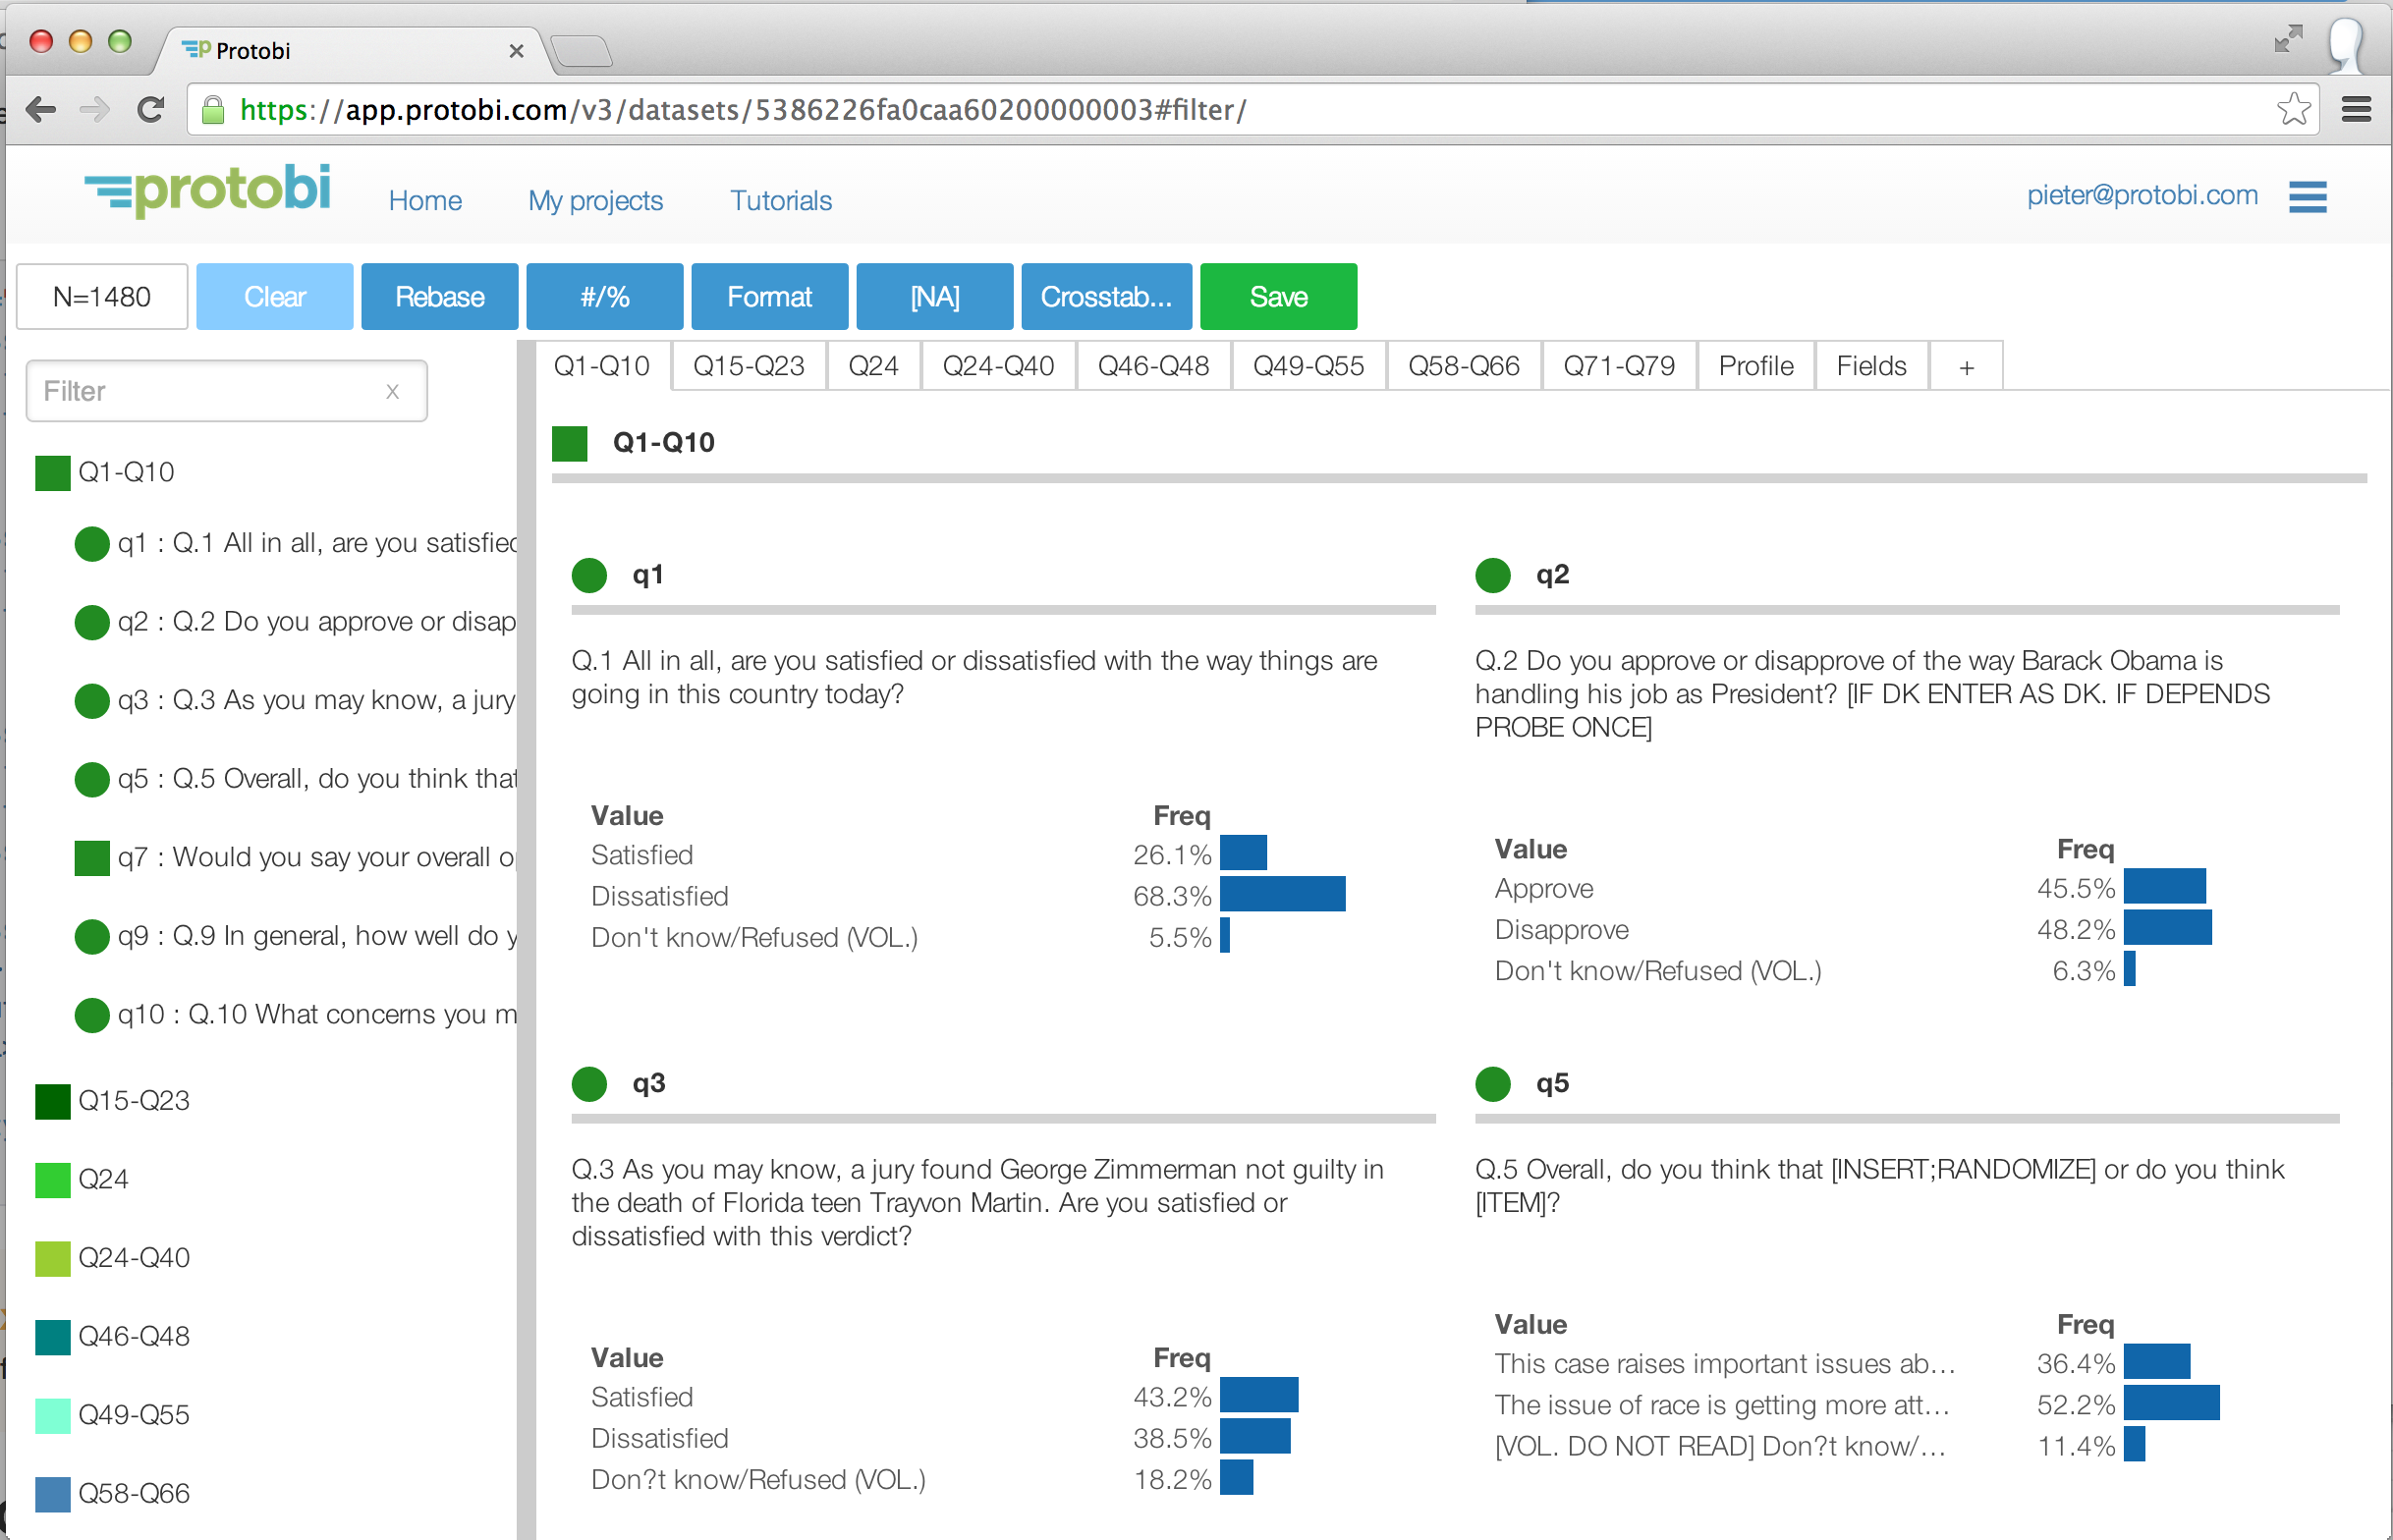
Your deck.js Presentation

An interactive tutorial with clickable examples.

Use the arrow keys to advance the slide.

You've fielded a survey! Now...

Open the data.

Find the story.

Write the report.

Share with client.

Keep for later.

A brief tour of Protobi

Tool bar
Search bar
Tree shows
elements
organized
conceptually
Each field is an
interactive element
Variable and value labels
displayed from data file
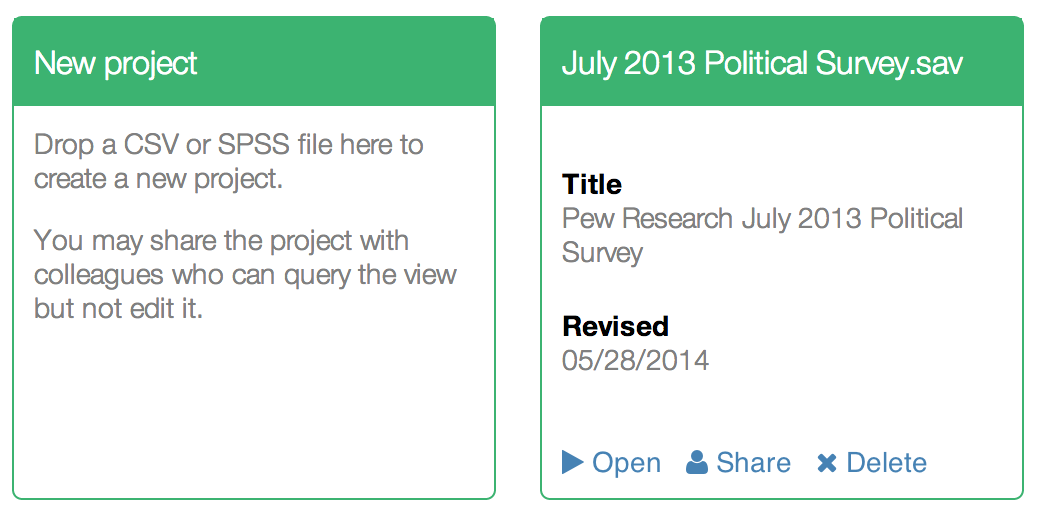
Bookmark or share the URL
to save interesting views
Tabs organize
elements graphically
Click any value to
subset and query the data

Interactive elements

Click on any value to drill in or out ... try it!

Scenario Toolbar


Drag-and-drop crosstabs

Drag AGE onto SPECR to create a crosstab. Drag out to clear.

Blank/missing values

Press the [NA] button to toggle how missing values are handled

Export as image or data

Press the icon to copy an element as image or data

Copy data to Excel

Create custom charts and analyses

Rounding

Press the icon to change the rounding

Set to 0 for no rounding, or auto to choose automatically.

Multiple response sets

Compact display of checkboxes and ratings

Click to see detailed responses.

Multiple-value responses

A patient may have more than one diagnosis recorded

Click and select 'Expand' to see individual responses.

Create or open a project

Open an existing project or create a new one

Types of users

Viewer

  • Read-only

  • Easy

  • Stable

  • 95% of users

  • 5% of features

Designer

  • Read-Edit-Create

  • Advanced

  • Rapidly evolving

  • 5% of users

  • 95% of features