Protobi helps you find and present the stories in your survey data.
Whether you have a single survey you need to analyze now or thousands, Protobi helps you quickly see your data, collaborate with colleagues, and impress clients. In time and budget.
Whether you have a single survey you need to analyze now or thousands, Protobi helps you quickly see your data, collaborate with colleagues, and impress clients. In time and budget.

Protobi provides compelling deliverables for your survey today.
A workspace contains an interactive chart for every question.
Organize and customize charts, turning responses into answers.
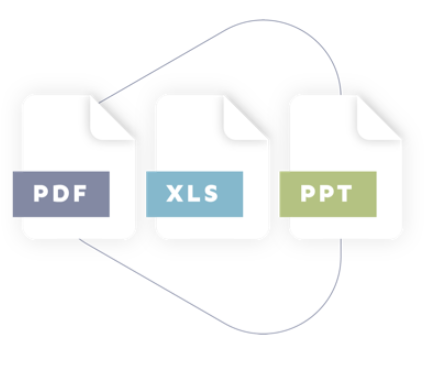
Export to PowerPoint and Excel as editable objects.
Share online access with your team and client.
Do advanced data processing and calculations in one place.
Get expert help to design your workspace, or even draft slides.

If you have many surveys, Protobi organizes your work neatly under your brand.
Share interactive views in your branded portal, with your theme or your clients.
Provide clients early access to their data, to ask and answer their questions.
Amaze your clients, increase proposal win rates, and reduce billable hours.
Create a searchable repository of all your surveys.
Transfer analysis best practices across research teams.

If you seek a coherent solution for all your surveys, Protobi Enterprise may be for you.
Create your own private Protobi, under your brand in your client portal.
Have your machines talk to our machines with Protobi APIs.
Import all your surveys into a searchable repository.
Enjoy flat rate pricing and service level agreements.

Upload survey data from leading tools like Confirmit, Dimensions, Decipher, Qualtrics, Typeform and Survey Monkey and create an instant interactive dashboard.
The data is automatically organized like the survey and every question becomes a clickable chart.

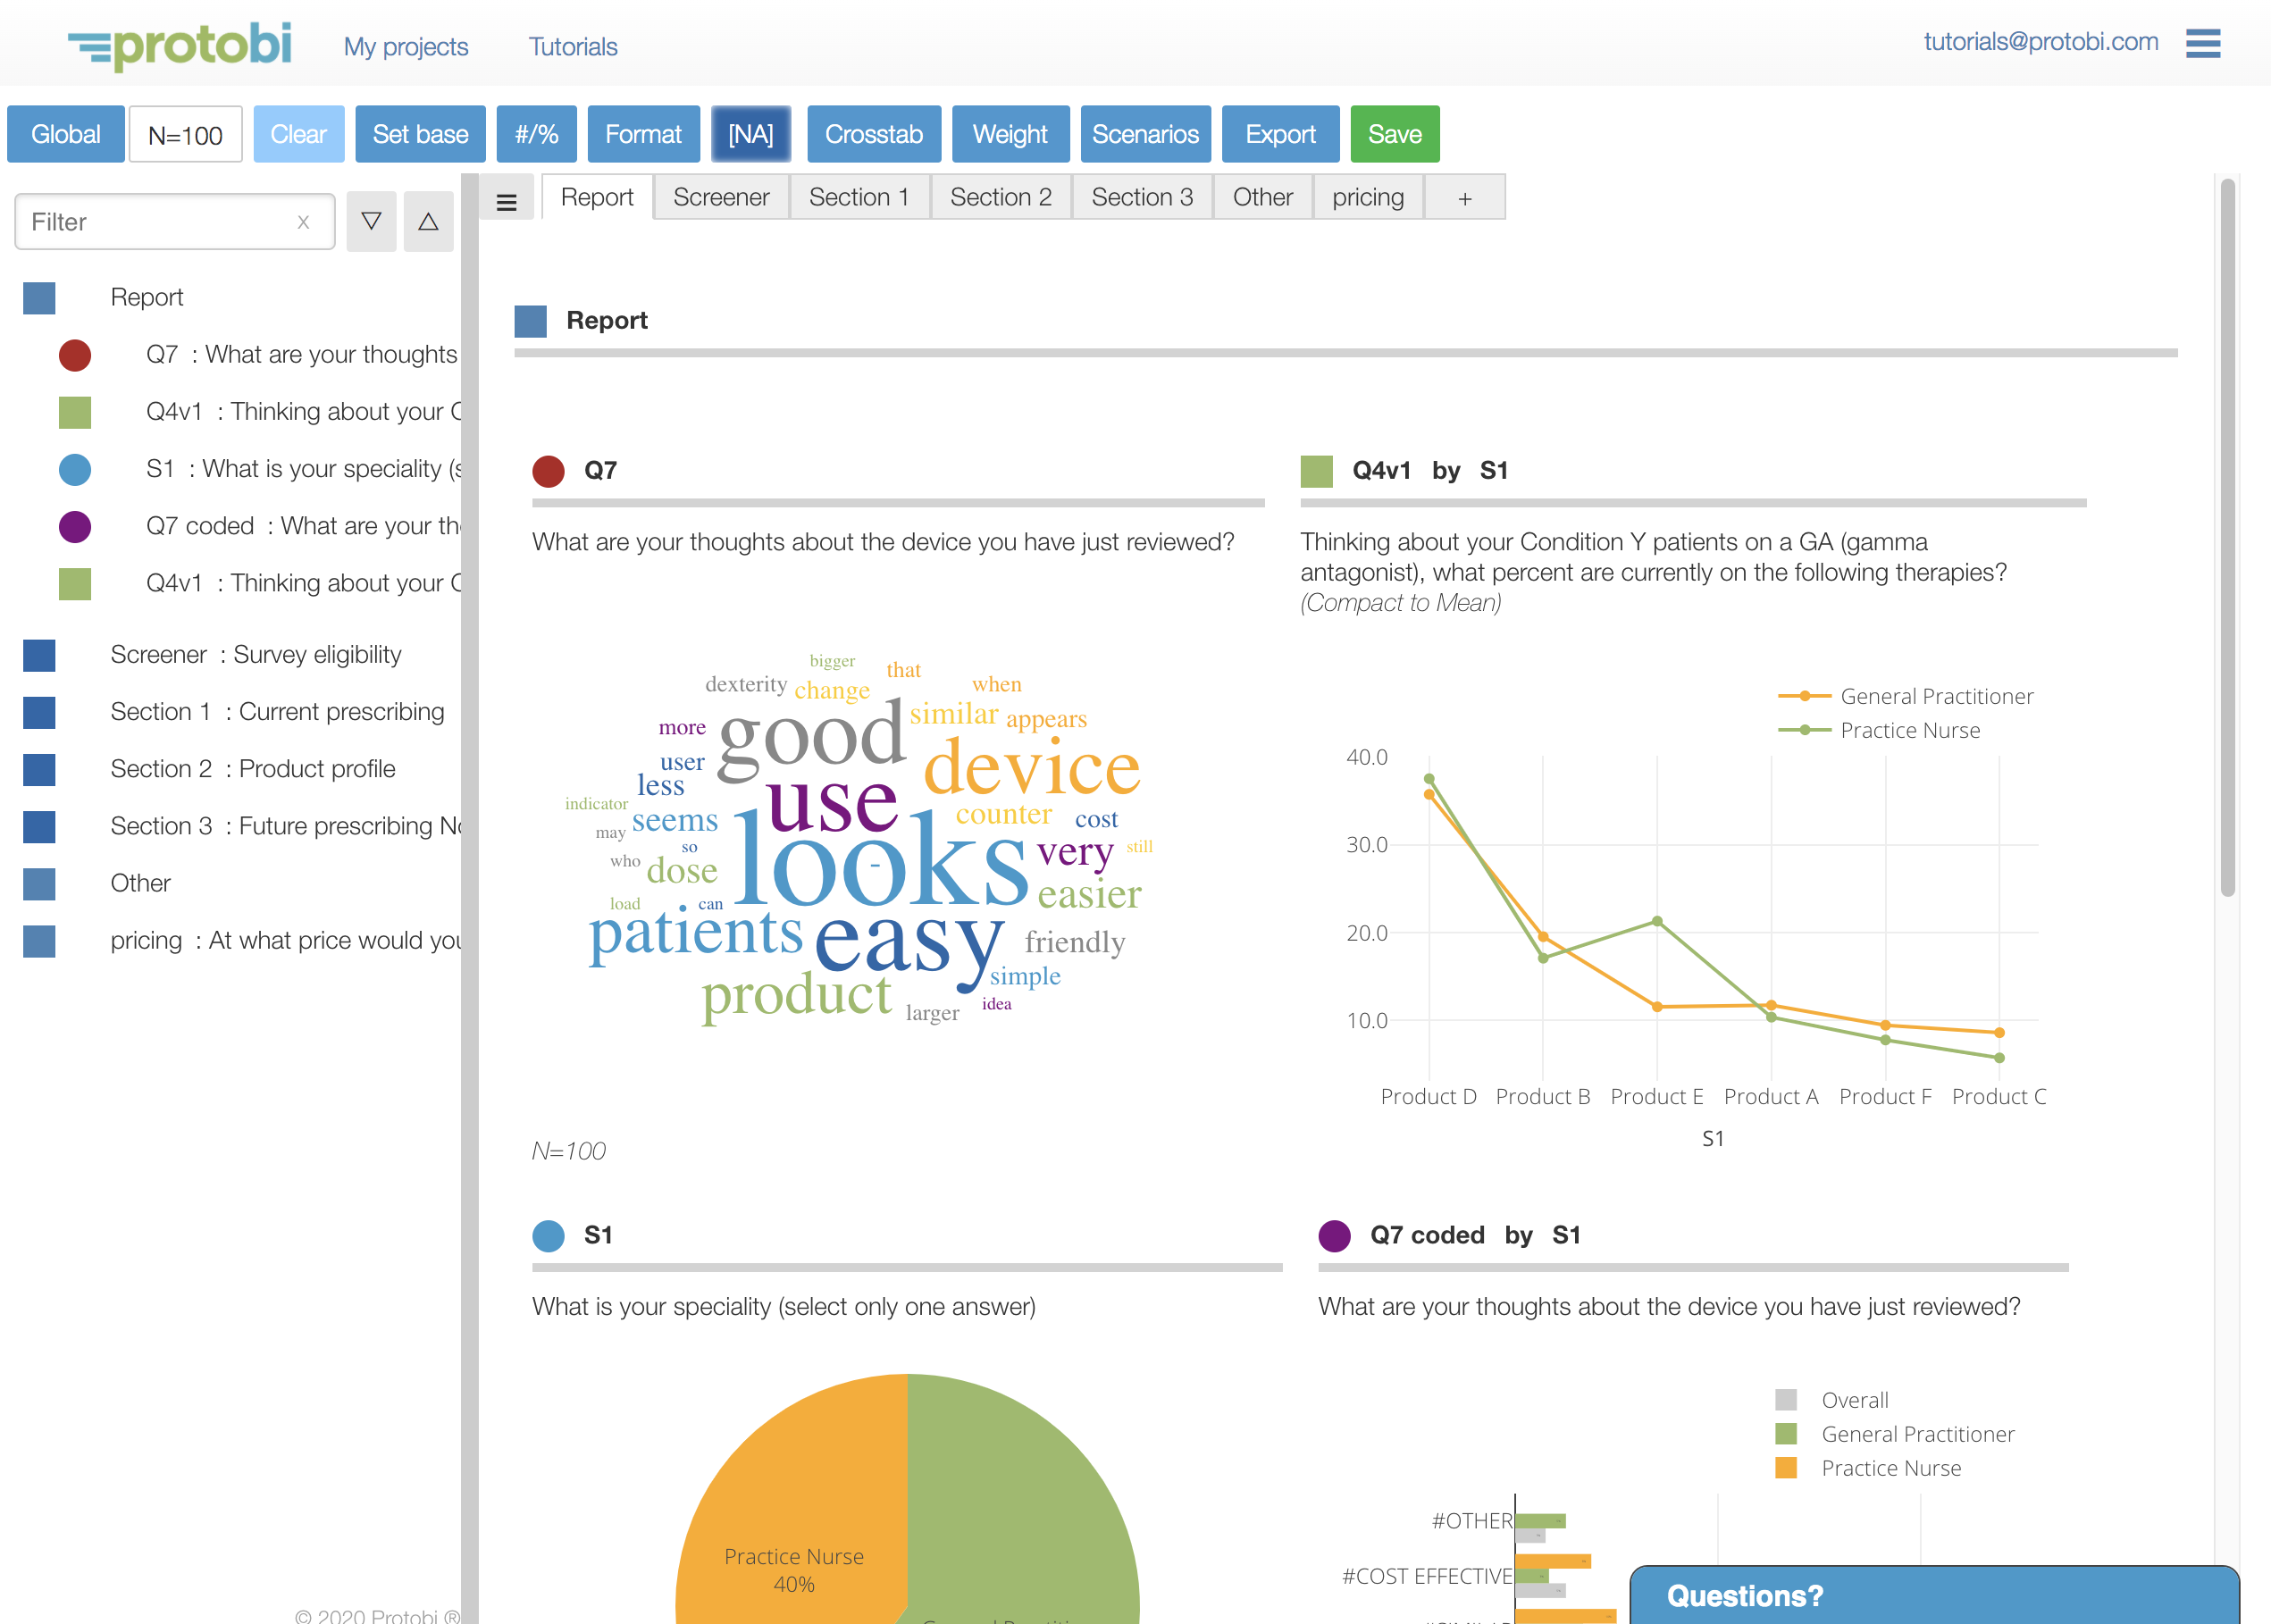
Find the stories in your data with Protobi’s easy-to-use browser interface.
Click to drill in. Drag to crosstab. Scroll to explore.
Statistically significant differences are automatically highlighted.
Design the view to your preference with a variety of chart types.

Share your data and analysis securely with your team.
Progressively customize the data view to become your client presentation.
Export or update presentations in native PowerPoint.

Deliver your analysis in an interactive client portal.
Win over clients by showing the compelling stories in the data.
Answer followup questions on the spot with interactive charts.
Protobi creates instant online interactive visualizations for an entire survey. You can explore the data, further organize the data into groups and tabs, and share it securely with colleagues and clients.

Instant crosstabs
Drag and drop text coding
Click any value to subset the data
Statistical comparisons to baseline
Bin numeric ranges
Missing/blank/skip values
Check-all-that-apply
Verbatim text analysis

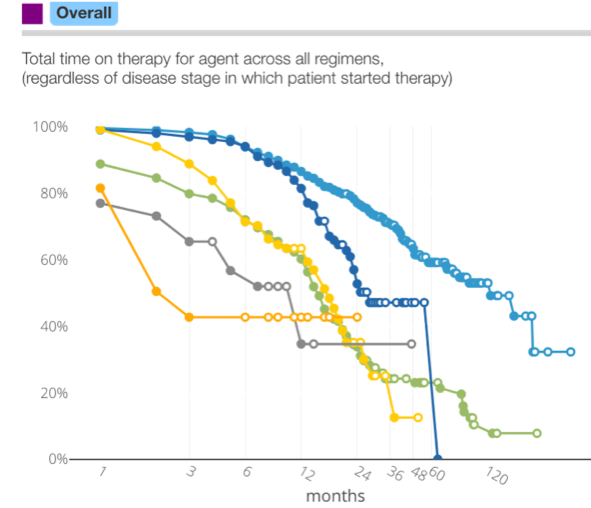
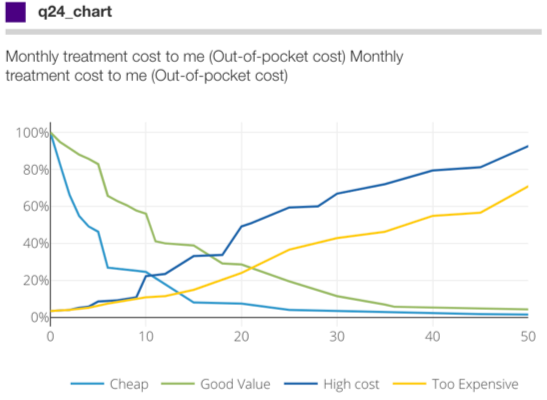
Bars, columns, pies, lines
Bars, columns, pies, lines
Tornado charts
Venn diagrams
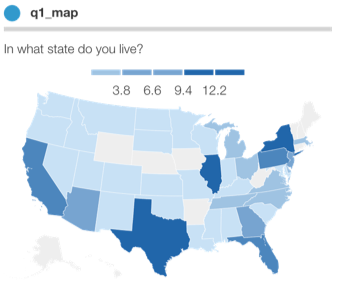
Geographic maps
Sankey diagrams
Paired tables
Custom charts
Word clouds
Crosstabs
Independent and pairwise tests
Highlight significant differences
Combine variables
Complete data processing
Auto language translation
Verbatim coding
Individual level weighting

Export to Excel, PowerPoint, PDF
Advanced data cleaning in JS or SPSS syntax
Merge multiple datasets
Calculate and apply weights
Update early and often
Bin numeric ranges
Missing/blank/skip values
Check-all-that-apply
Verbatim text analysis

Standard chart types for every data type; specialized charts for presentation and analysis. More
As one example, Protobi delivers online interactive views of the CDC National Ambulatory Medical Care Survey (NAMCS), an annual public health survey to understand outpatient care in the US.
NAMCS is a survey of thousands of physicians, with detailed patient report forms, stratified sampling and weighting.
Protobi provides access to this important data as a public service.
Learn more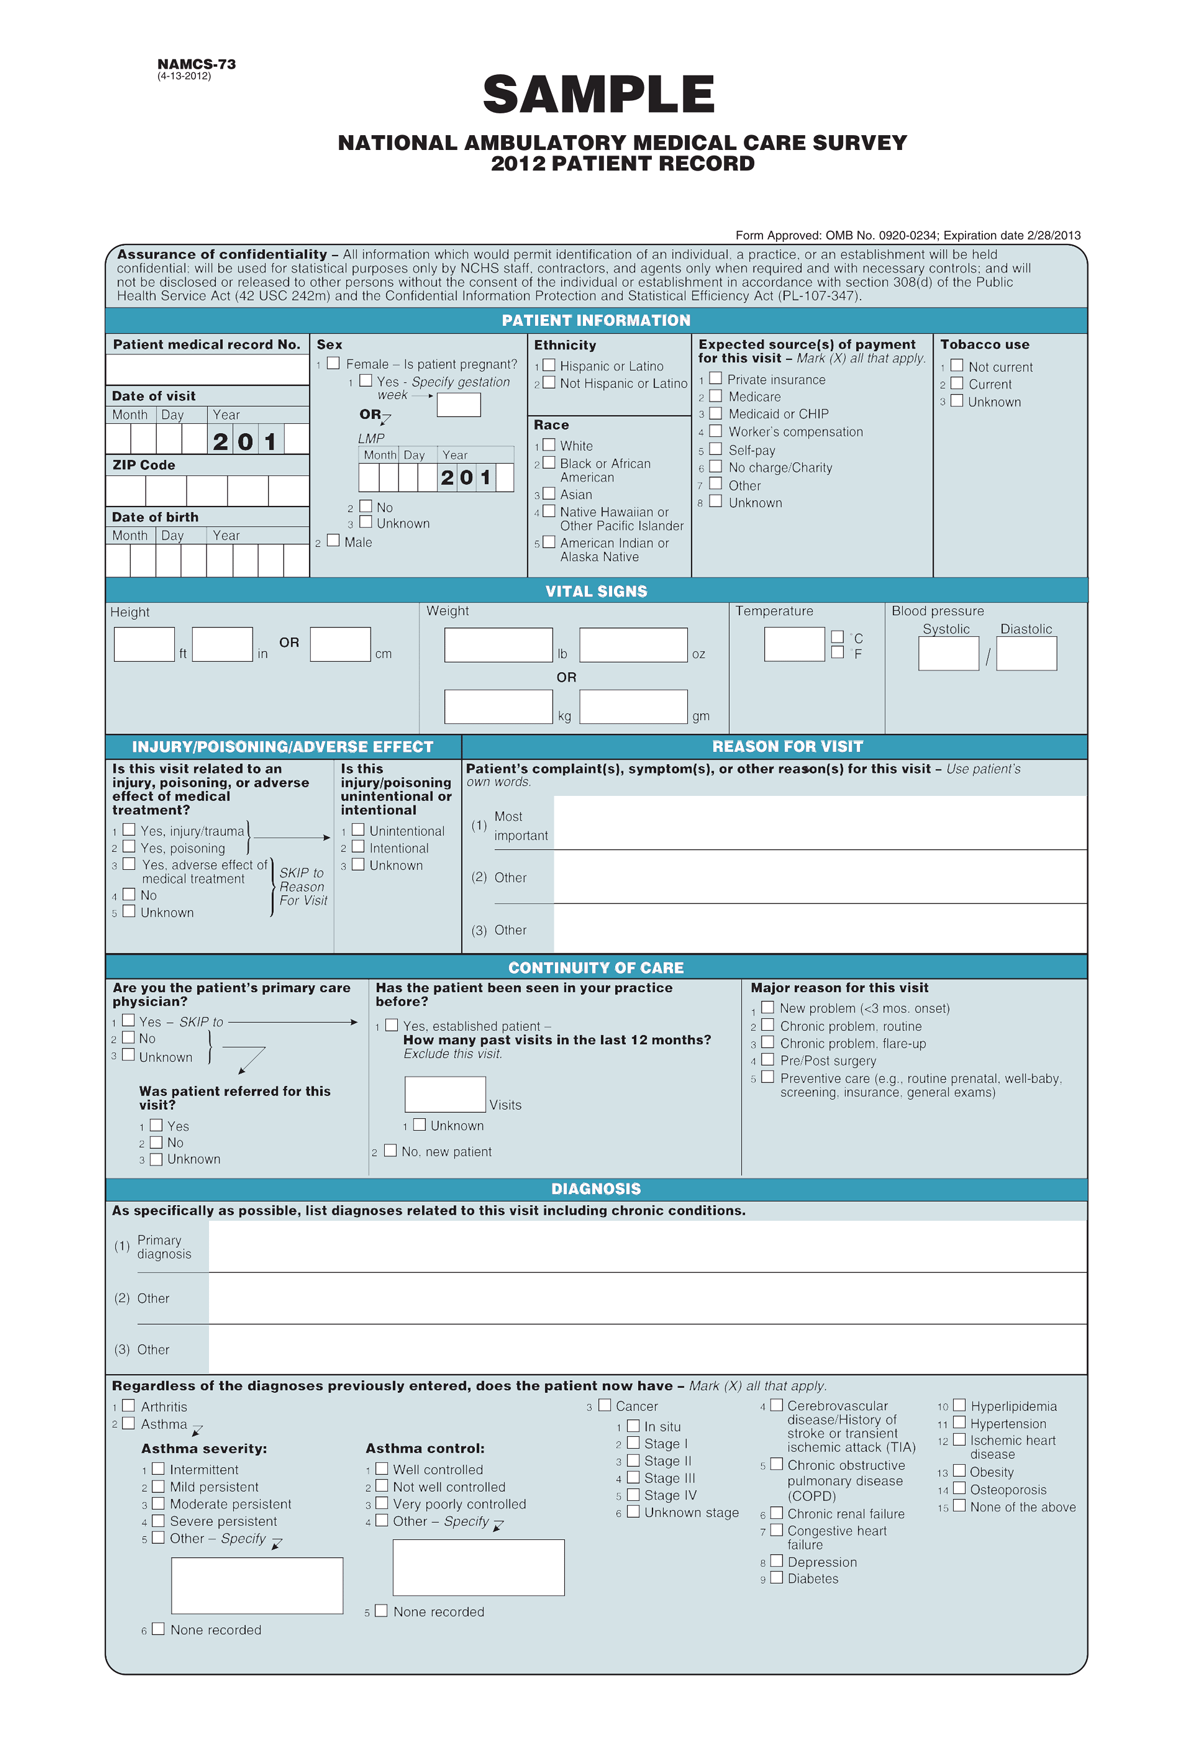 Patient report form
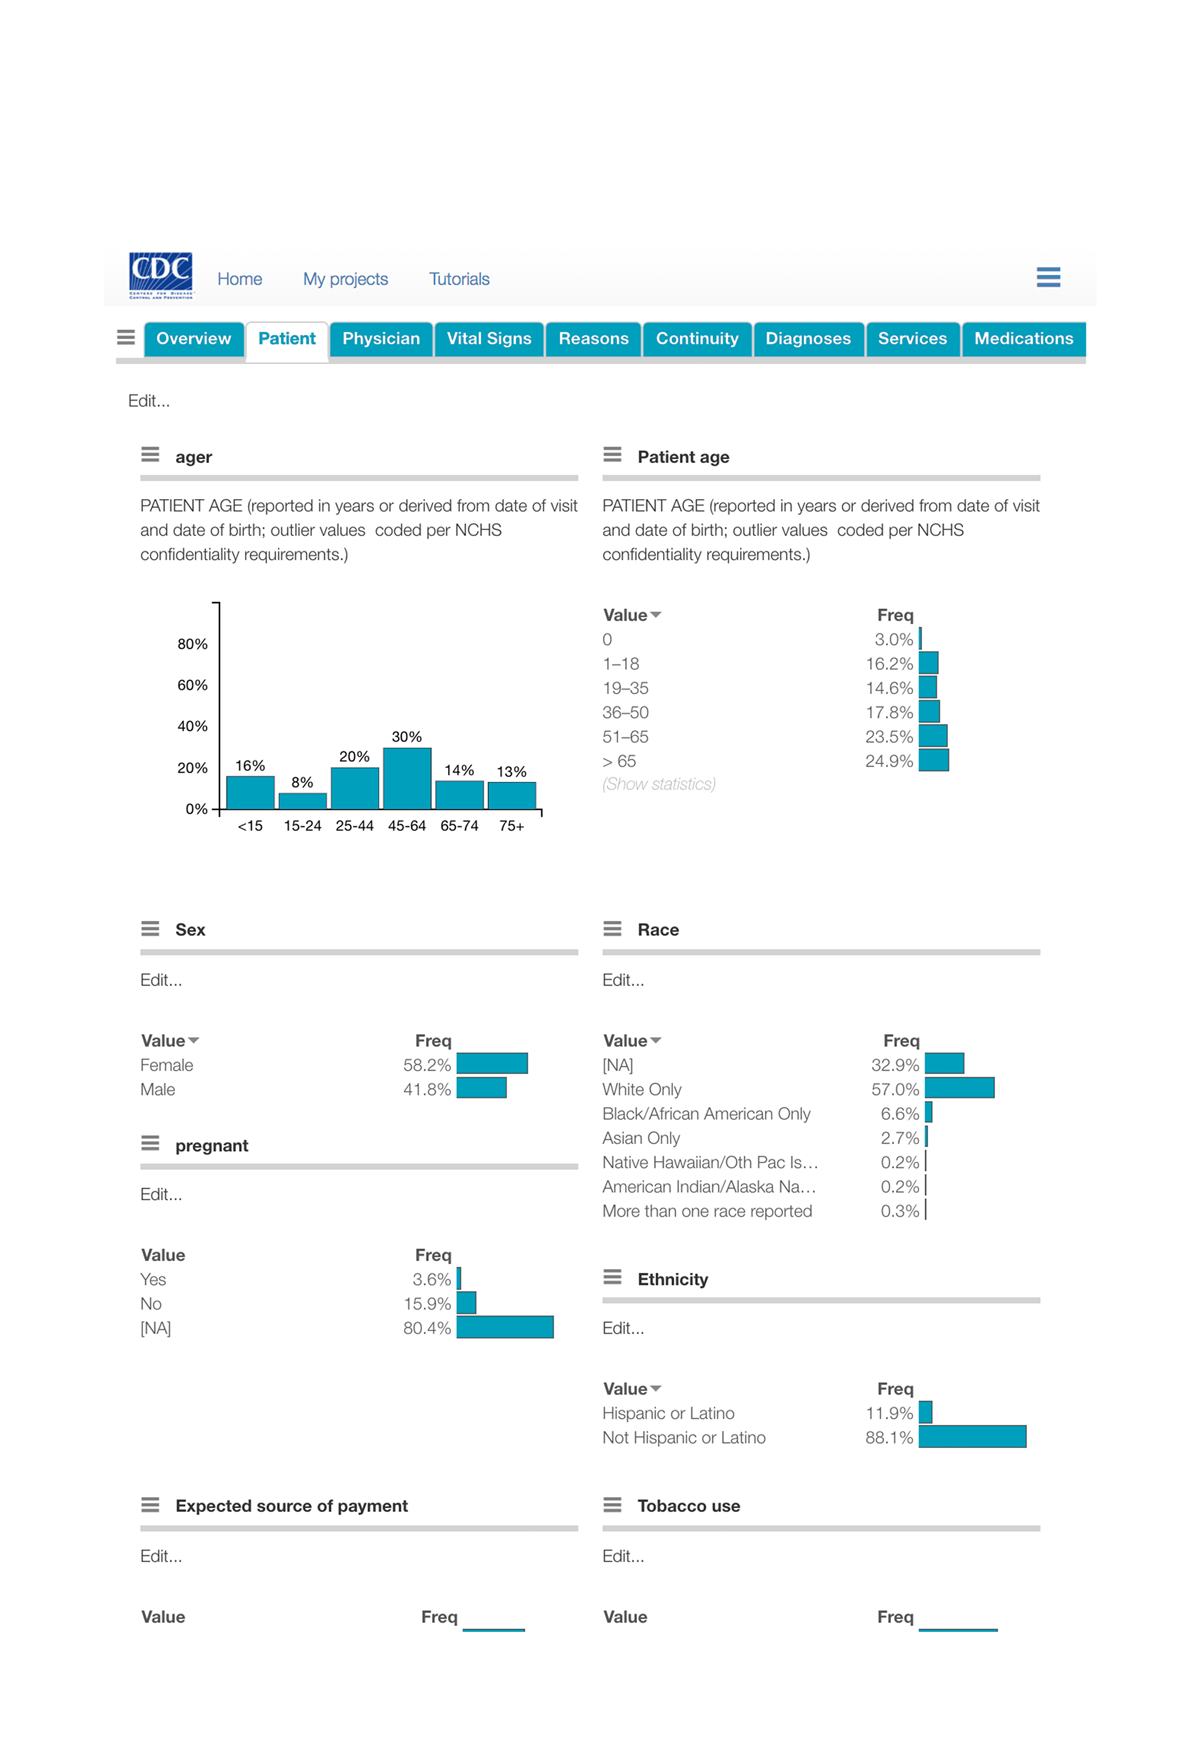 Interactive view in Protobi
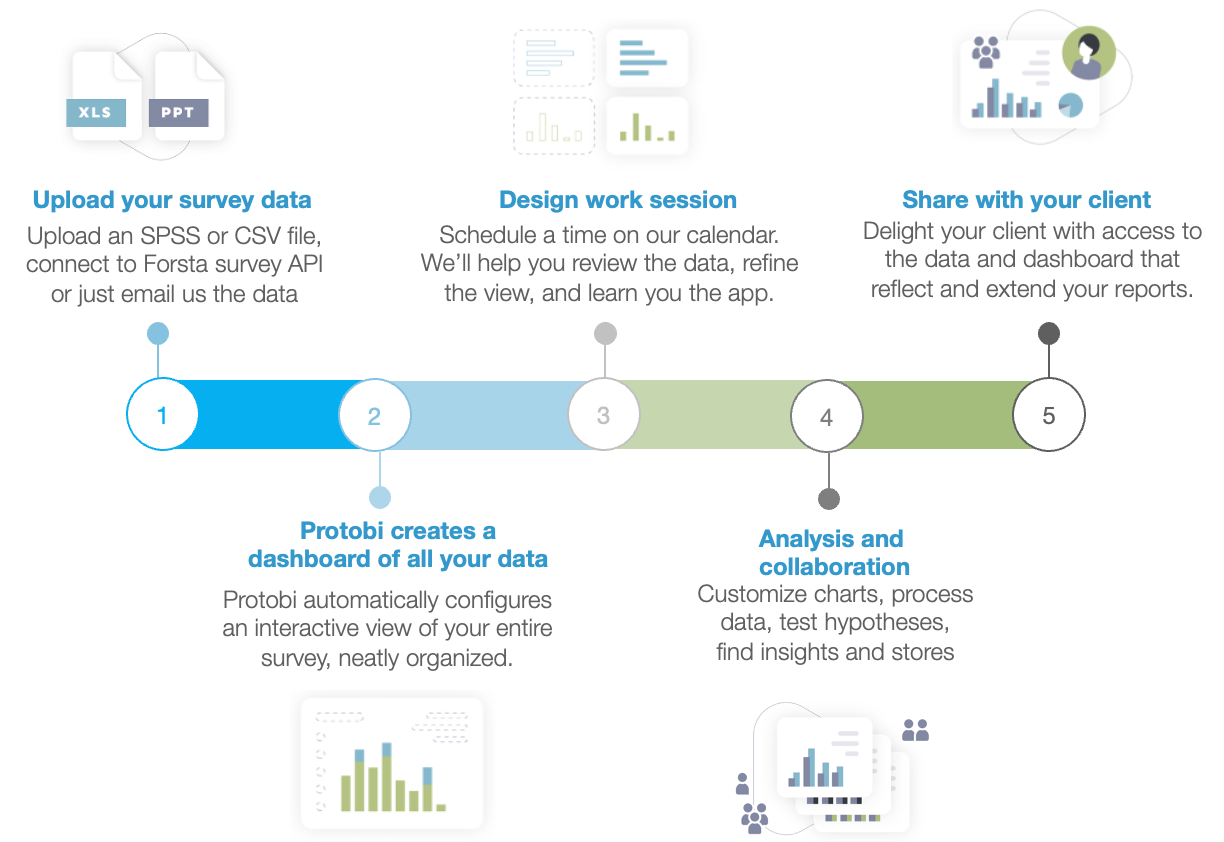
Typically you get a complete interactive dashboard of your entire survey right away, starting with an SPSS data file or a direct API connection to your survey engine such as Forsta.
From there you can share access with your team and work collaboratively to explore the data and build your deliverables. We're available to help you through any specific aspects of your project from data processing to polished design.