Print layout
July 20, 2020
We're excited to release print layout charts. These are designed to provide precise control over layout and a wide variety of options, within a coherently styled family of charts.
| 18% | 26% | 30% | 15% | 10% | |
| 11% | 23% | 40% | 16% | 11% | |
| 10% | 16% | 35% | 24% | 15% | |
| 10% | 20% | 39% | 20% | 12% | |
| 9% | 16% | 29% | 29% | 16% | |
| 9% | 16% | 29% | 23% | 23% | |
| 9% | 13% | 26% | 29% | 24% | |
| 7% | 14% | 28% | 32% | 19% | |
| 6% | 9% | 21% | 32% | 32% |
Style options
They have lots of options to fit different sizes and orientations. For instance, make the left margin small enough and row labels appear above the row , which can be great for longer text that may need just a bit of room to breath or allow even longer labels to wrap.
Engaging story | ||||
| 18% | 26% | 30% | 15% | 10% |
Quality acting | ||||
| 11% | 23% | 40% | 16% | 11% |
Surprising / suspenseful plot | ||||
| 10% | 16% | 35% | 24% | 15% |
Buzz among friends, social media | ||||
| 10% | 20% | 39% | 20% | 12% |
Location / setting / scenery | ||||
| 9% | 16% | 29% | 29% | 16% |
Believable villain | ||||
| 9% | 16% | 29% | 23% | 23% |
Star performances | ||||
| 9% | 13% | 26% | 29% | 24% |
Special effects | ||||
| 7% | 14% | 28% | 32% | 19% |
Realism / based on actual events | ||||
| 6% | 9% | 21% | 32% | 32% |
Interactive
These charts are interactive like other Protobi elements. You can click to select, to edit, and crosstab:
| 32% | 33% | 25% | 10% | 0% | 65% | 496 | |
What is your gender? | |||||||
| 42% | 34% | 19% | 5% | 0% | 76% | 255 | |
| 21% | 32% | 32% | 16% | 0% | 52% | 241 | |
What is your age? | |||||||
| 32% | 27% | 32% | 9% | 0% | 59% | 22 | |
| 40% | 26% | 26% | 7% | 0% | 66% | 136 | |
| 40% | 34% | 16% | 10% | 0% | 74% | 131 | |
| 22% | 35% | 30% | 12% | 0% | 57% | 129 | |
| 17% | 42% | 28% | 13% | 0% | 59% | 78 | |
What is the highest education level that you have completed? | |||||||
| 37% | 24% | 27% | 12% | 0% | 61% | 122 | |
| 33% | 18% | 36% | 12% | 0% | 52% | 33 | |
| 31% | 38% | 23% | 8% | 0% | 69% | 282 | |
| 24% | 36% | 25% | 15% | 0% | 59% | 59 | |
Export
Print layout also play well with media you might use to present data to clients.
Print layout charts can be included as fully interactive element in a live Protobi "wiki" report, , as semi-interactive HTML in an online report, as native PowerPoint charts, tables or shapes. The charts above are included here as HTML that provides clear zoomable graphics and tooltips on hover, but are just static charts a client cannot break.
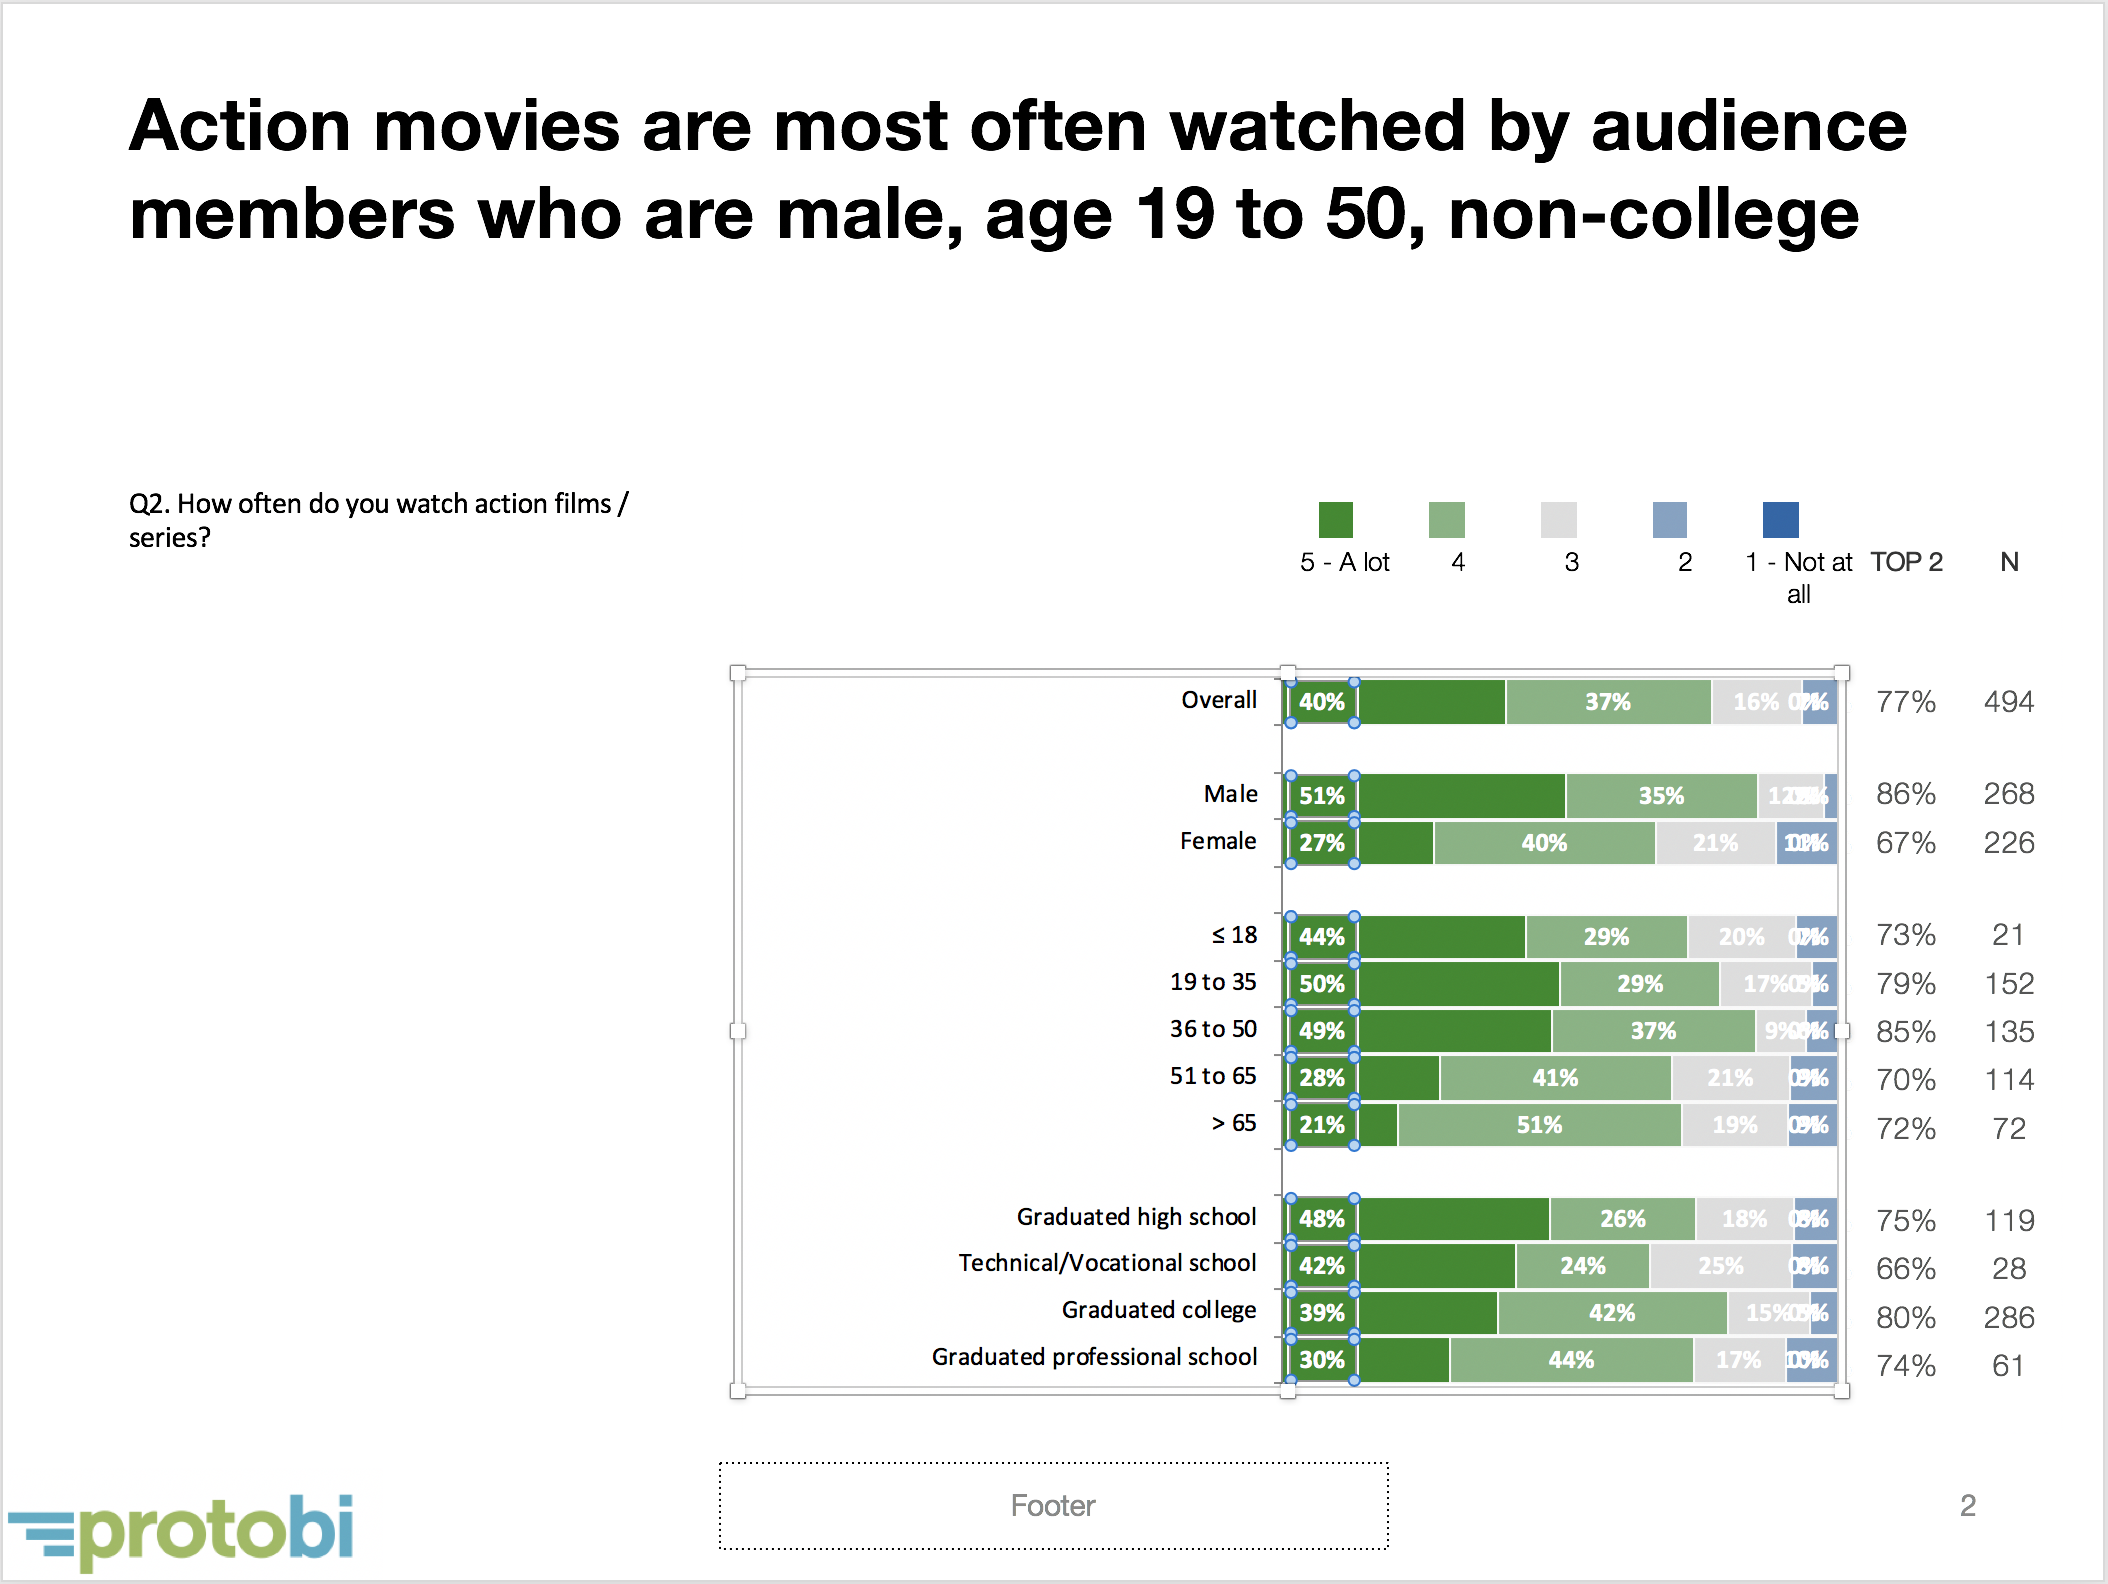
You can also export them to PowerPoint, where the chart is rendered as a combination of native editable Powerpoint chart, table, and shapes.
The chart body is a PowerPoint chart with embedded Excel data, and the chart is exactly sized to match the online view and line up with the summary statistcs:

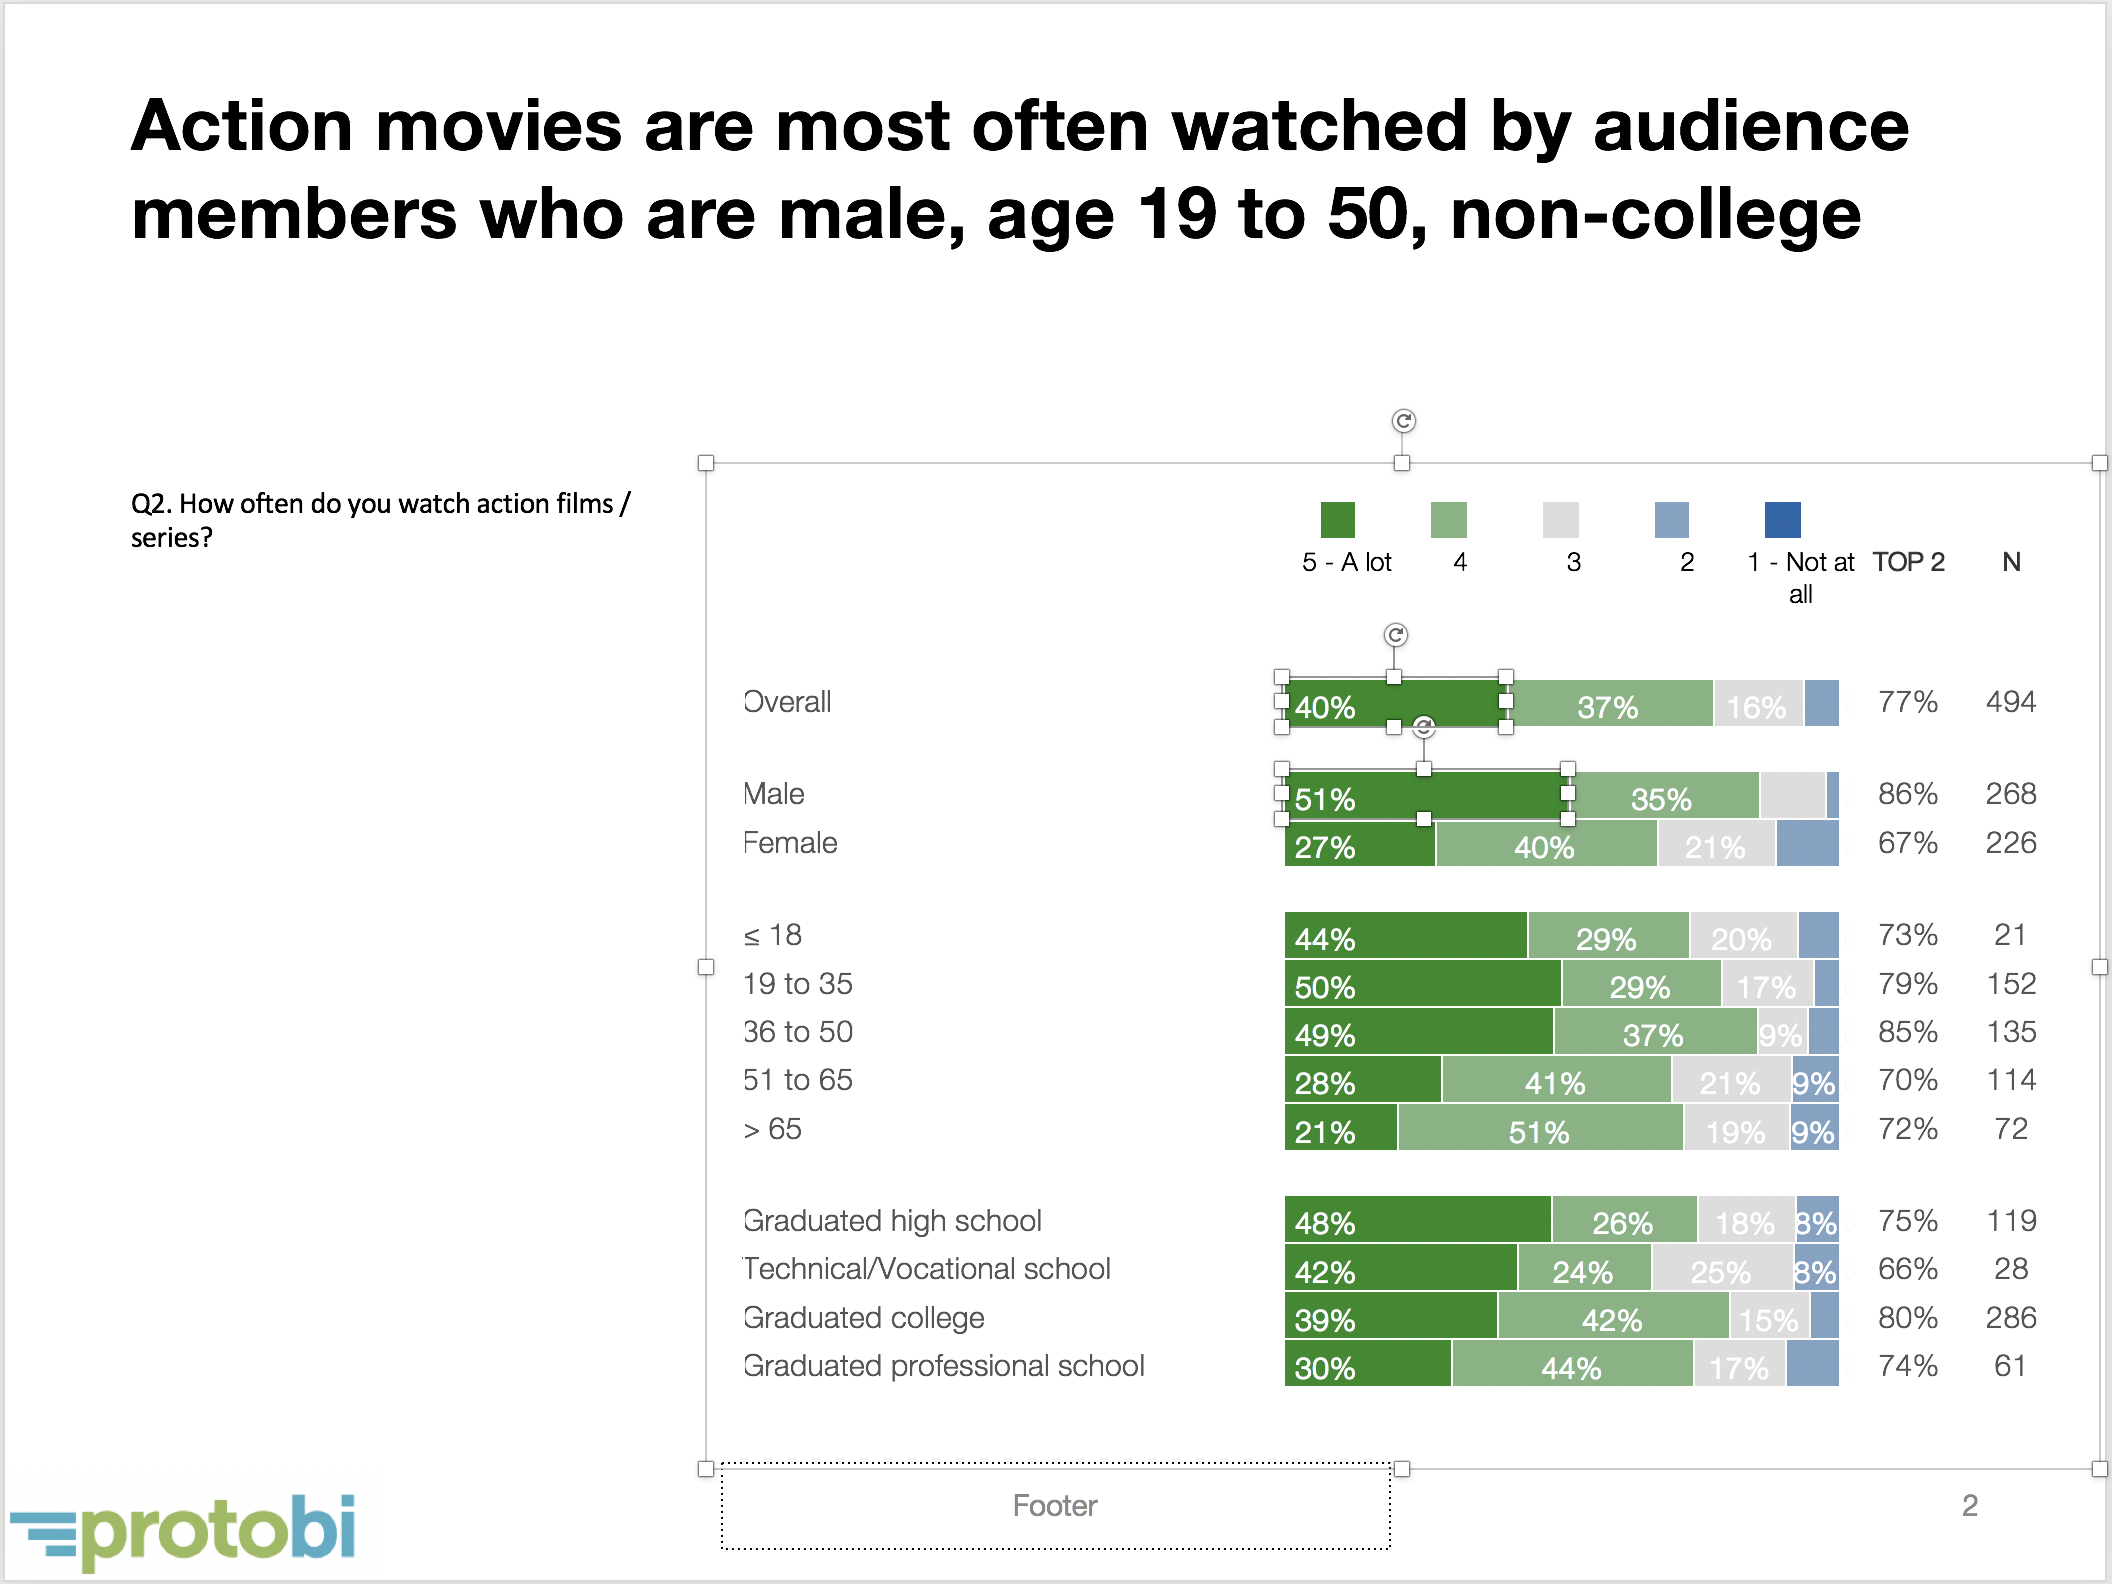
Delete the chart to expose a group of drawing shapes that even more precisely reflect the chart as rendered online:

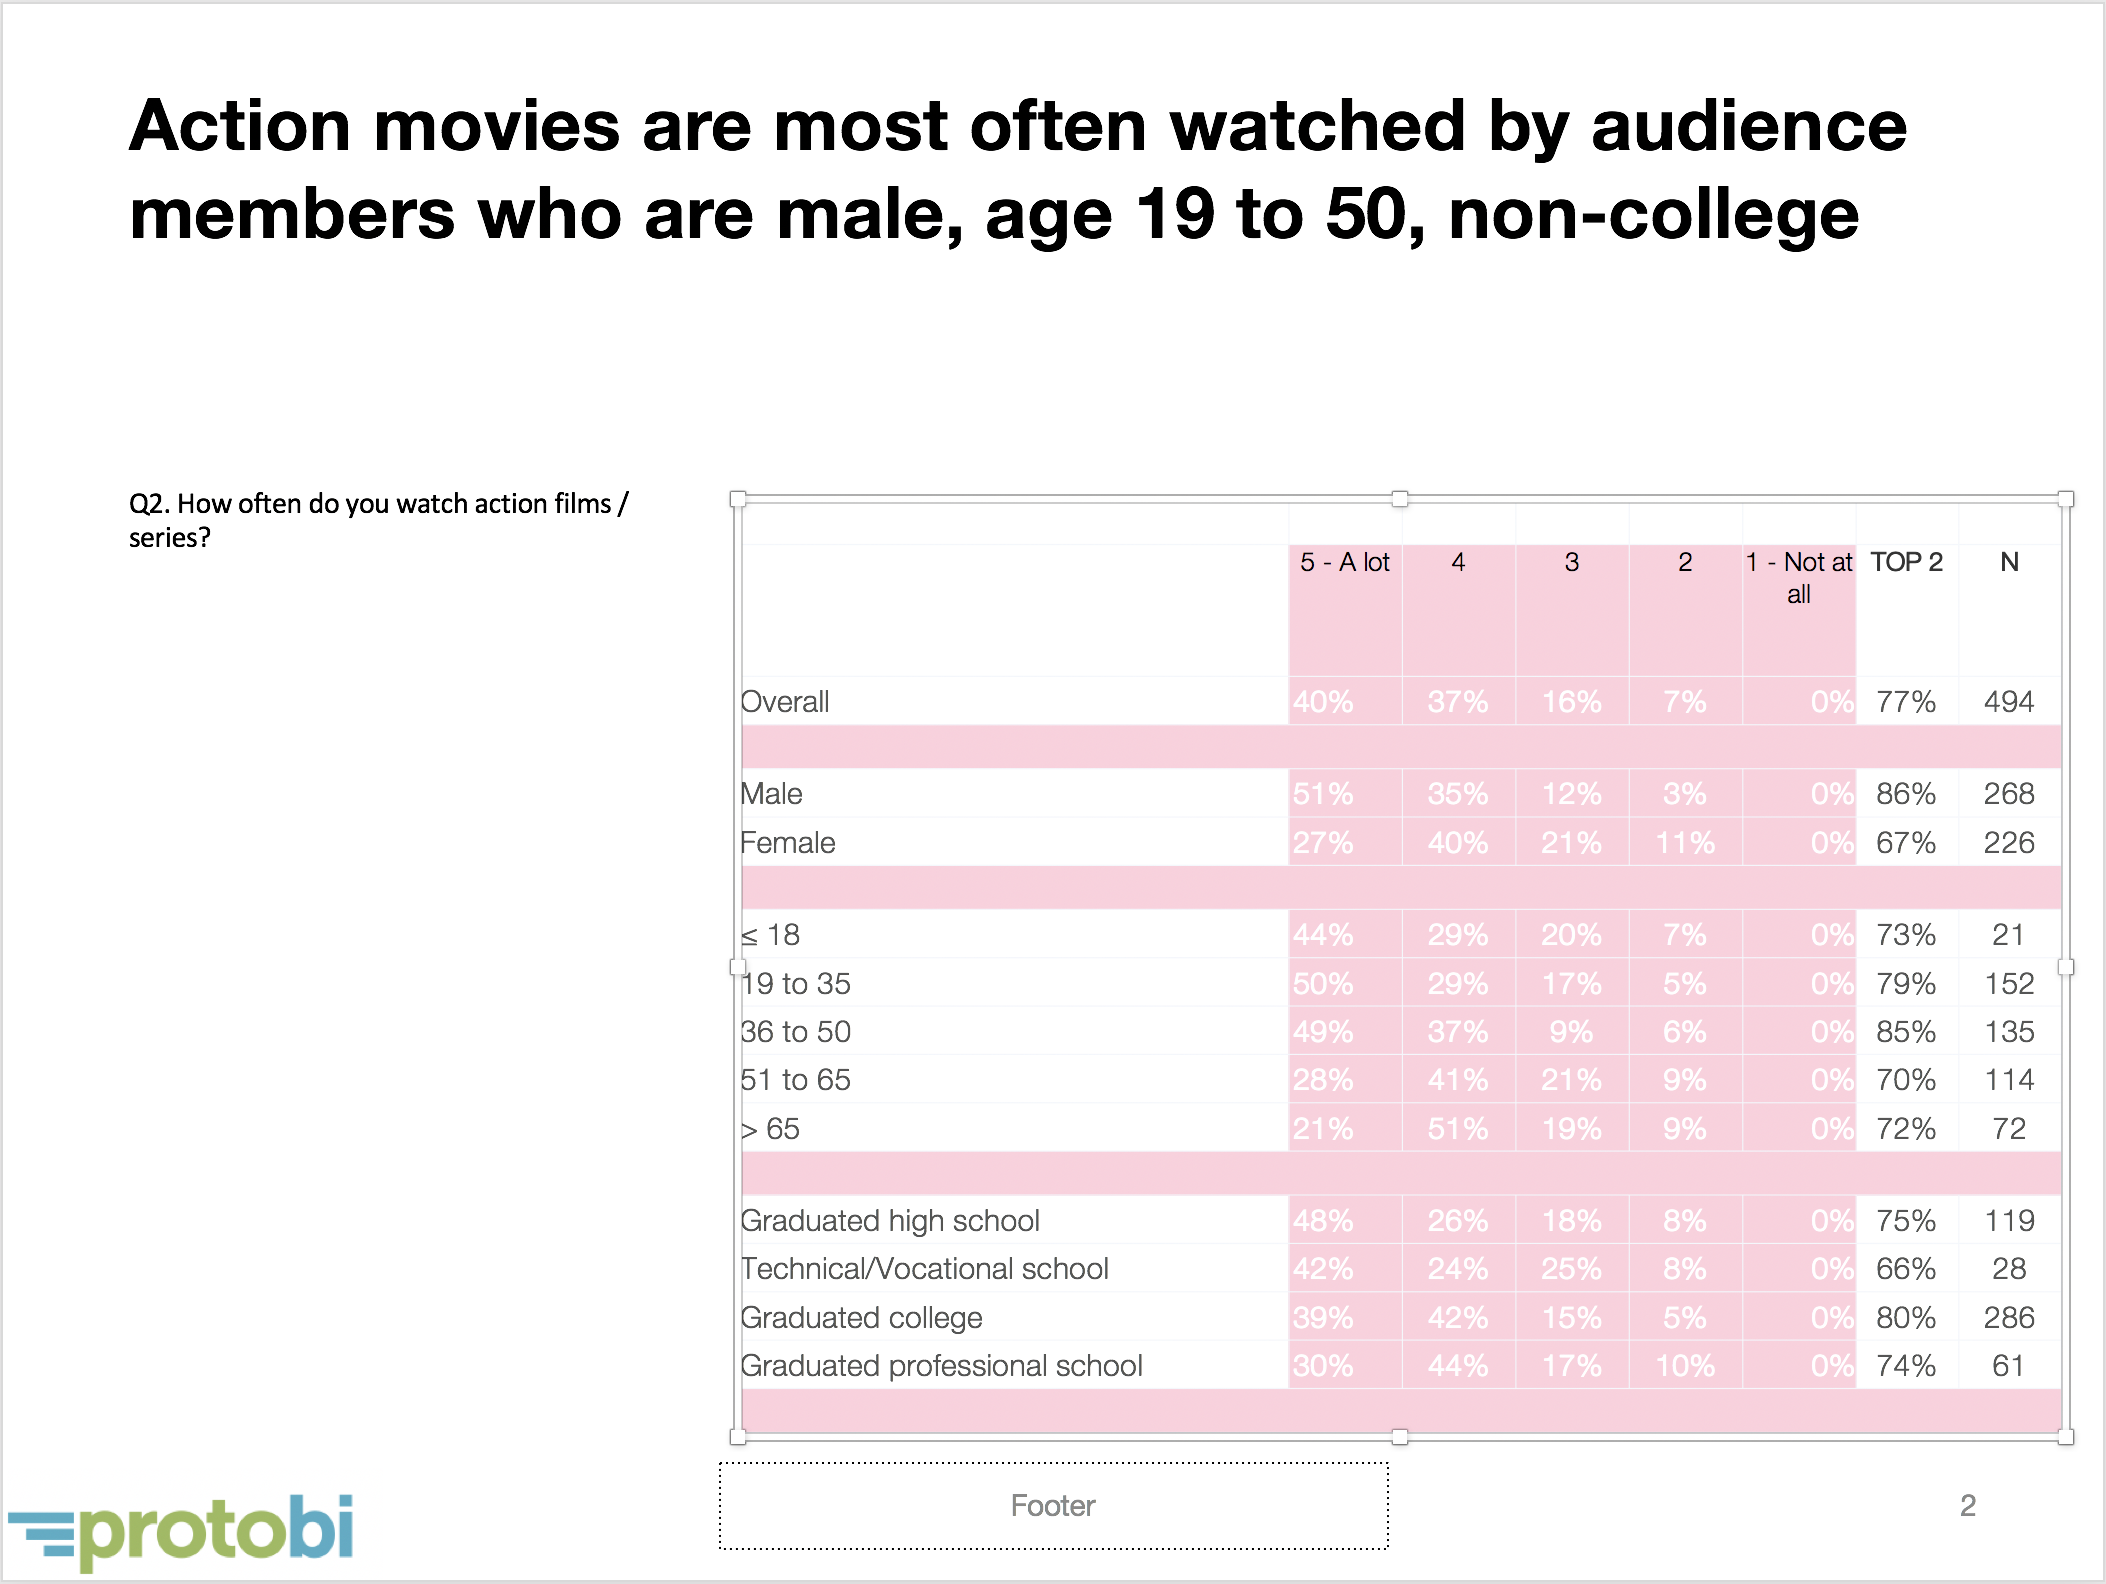
And then delete the shapes to expose the underlying table with all the cell values neatly arranged:

For more information, visit https://sermo.com or contact support@protobi.com.
