Revenue per employee and biologic scaling laws
August 7, 2012
Out of curiosity, I wanted to see how a particular firm would compare to other publicly traded firms should it go public as expected, on a number of ratios, including revenue per employee.
 Data is unfortunately sparse. There are a number of anecdotal references. For instance, the software firm 37signals provides this brief ranking of selected tech companies by revenue per employee. Fortunately, J. Bryan Scott has made available this far more comprehensive ranking of revenue and employee counts for the NASDAQ 100.
Plotting these as a histogram, a striking feature is the tremendous range, even within this relatively select group of firms. The ratio of revenue to employees varies from under $40,000 (Cognizant and Infosys) to over of $2 million (Hansen Natural Corporation).
The histogram has a remarkably bell-shaped distribution when plotted on a logarithmic scale. This is a classic feature of heavy tailed distributions generally and power-law distributions in particular.
Given this wide variation, one reasonable question is whether it even makes sense to think about revenue per employee as a ratio. Is the relationship between revenue and number of employees linear? Perhaps there is a more subtle relationship.
Plotting revenues versus number of employees on a scatter plot, we can see that there is in fact a clear relationship. And on a log-log plot, the relationships appears as a straight line. Mathematically, this means there is a "power-law" relationship. In simpler English, revenues are not proportional to the number of employees directly (as would be implied by a constant ratio) but rather increase less than linearly. So as the number of employees doubles, revenues don't also double, but rather increase by only 68% rather than 100%.
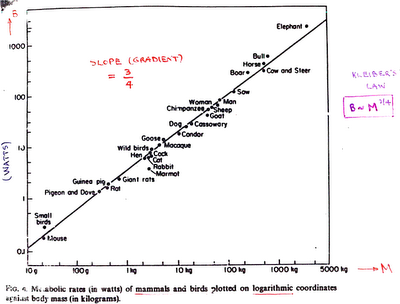
What's remarkable about the above graph is that the estimated slope of the line is 0.77. This is very nearly equal to 3/4, which is linked to a much wider set of phenemona described by similar scaling laws. The difference here is not statistically significant.In particular, this is the same slope as Kleiber's Law between metabolism and mass of biologic organisms, across an astonishing range of sizes.
For a fascinating overview see an excellent talk Geoffrey West, "Why cities keep on growing, corporations always die, and life is getting faster" at LongNow.org, or these slides from an earlier presentation. The ratio of 3/4 arises from network theory, suggesting that the scaling is an emergent property of interconnections.
In that presentation, West also presented the graph below, relating net income and total assets to the number of employees, for a broader set of firms. The slope for net assets is 0.79, very near the same magic ratio 0f 3/4. The slope for net income is estimated below at 0.88 for firms larger than 50 employees, but a slope of 3/4 would also better match the many small firms.
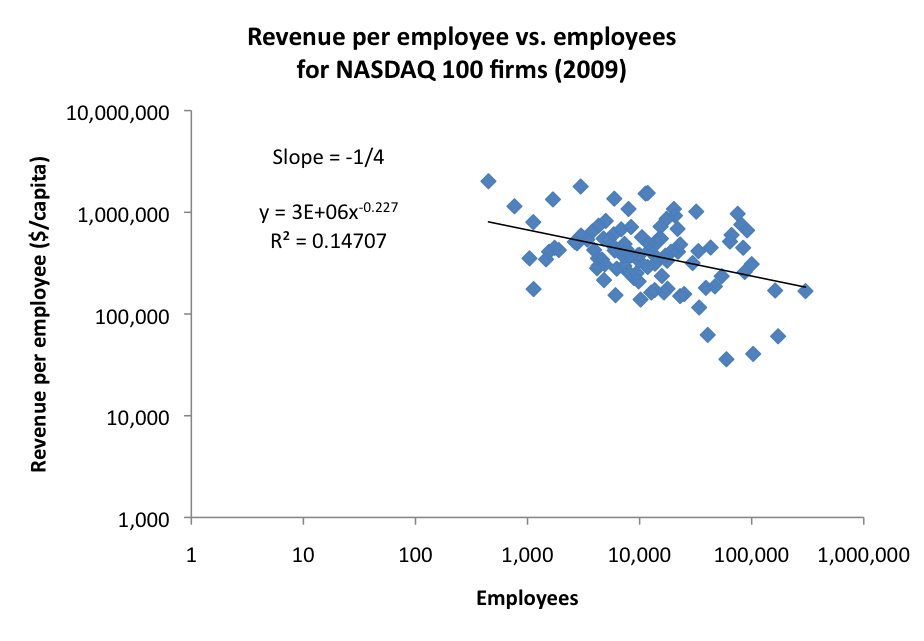
So back to the original question, what is a benchmark ratio of revenues to employees, and does that depend on the number of employees? The answer is that the ratio is not constant. Revenue per employee typically decreases as the number of employees increases, with an exponent of -1/4. So as a firm doubles in sizes, the revenues per employee decrease 16% on average.
For fun, we can imagine extrapolating to firms of just one employee. There are no such firms listed on the NASDAQ 100, but if one were we might expect it to have revenues around $3 million. Gulp. I'd better get cracking on business development!


