StackOverflow Developer Survey
August 16, 2014
Stack Overflow released the results and data for its 2013 annual survey of members. With 7,643 respondents it provides a fascinating glimpse what developers are working on, what they're excited about, their Stack Overflow activity, salary and careers. Explore the data in Protobi.
About Stack Overflow
Stack Overflow is the go-to forum for software developers, the ultimate crowd-source research site where you can usually find your question already answered, or if not, get new answers from smart thoughtful experts in minutes. They also have a wide array of sister sites on Stack Exchange on topics like Statistics, Cooking, and Automobile Repair.
Some interesting findings
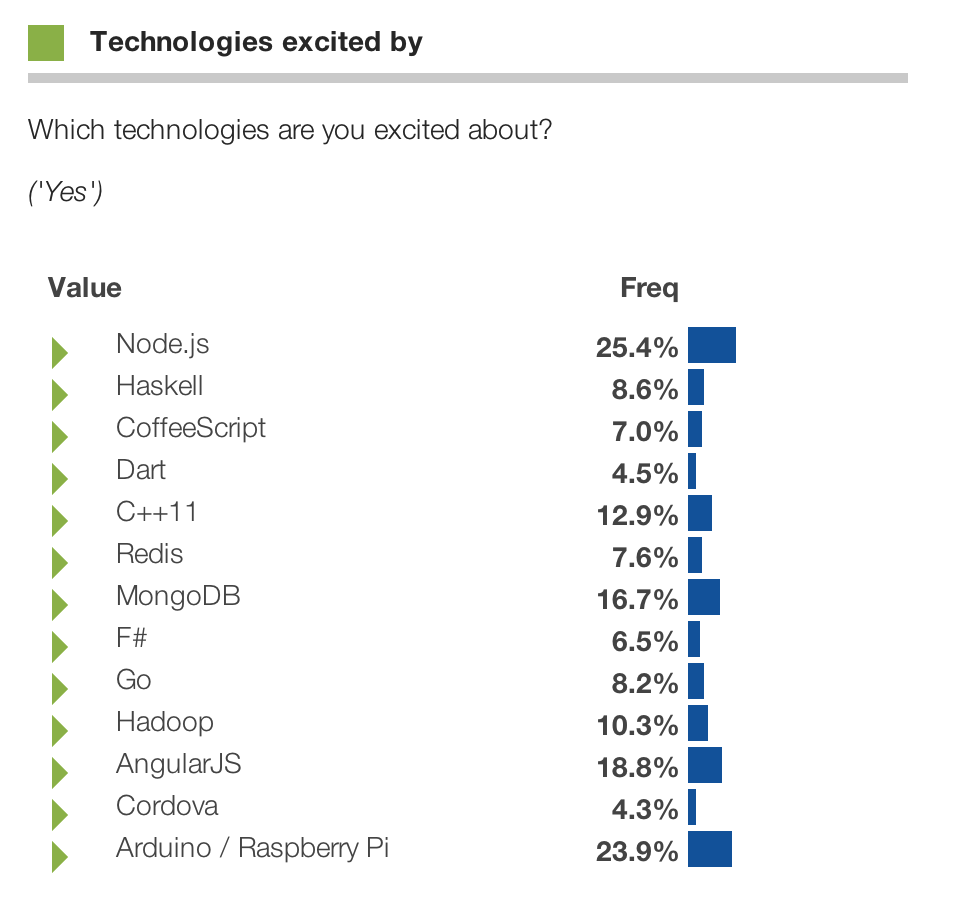
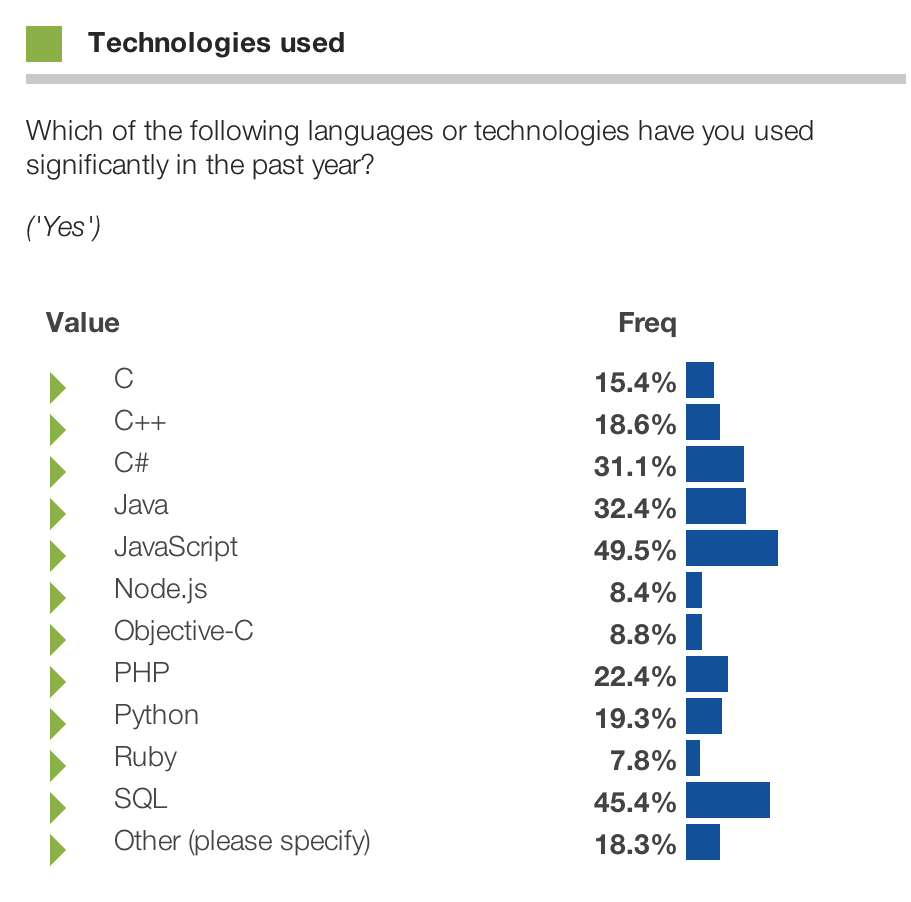
For instance, 25% of all respondents are "excited" about Node.js, but only 8.4% of all respondents have used it in the last year. However, of those who have used Node.js in the past year, 83% are excited about it.
Further, those members with super-high reputations (10,000+) are:
- Significantly more likely to have 10+ years experience
- Value control over work and quality a bit more than most, and
- Currently using more languages, and especially C.
Explore the data yourself. Tell us what you think Email us with questions, critiques or suggestions.
Discussion
It's interesting to note that Stack Overflow, a leading social Q+A platform, chose to run a traditional survey of its own members.
Joan Lewis, the head of research at P&G, arguably the largest buyer of market research globally, speculated in 2011 that by 2020 surveys will dramatically decline in importance, with the rise of social media as a big reason why.
“The more people see two-way engagement and being able to interact with people all over the world, I think the less they want to be involved in structured research.”
Certainly, you wouldn't want to answer a question like this one via a survey, nor might you want even a representative answer.
And arguably, you could observe what developers are working on and interested in by the questions they ask and the ones they answer.
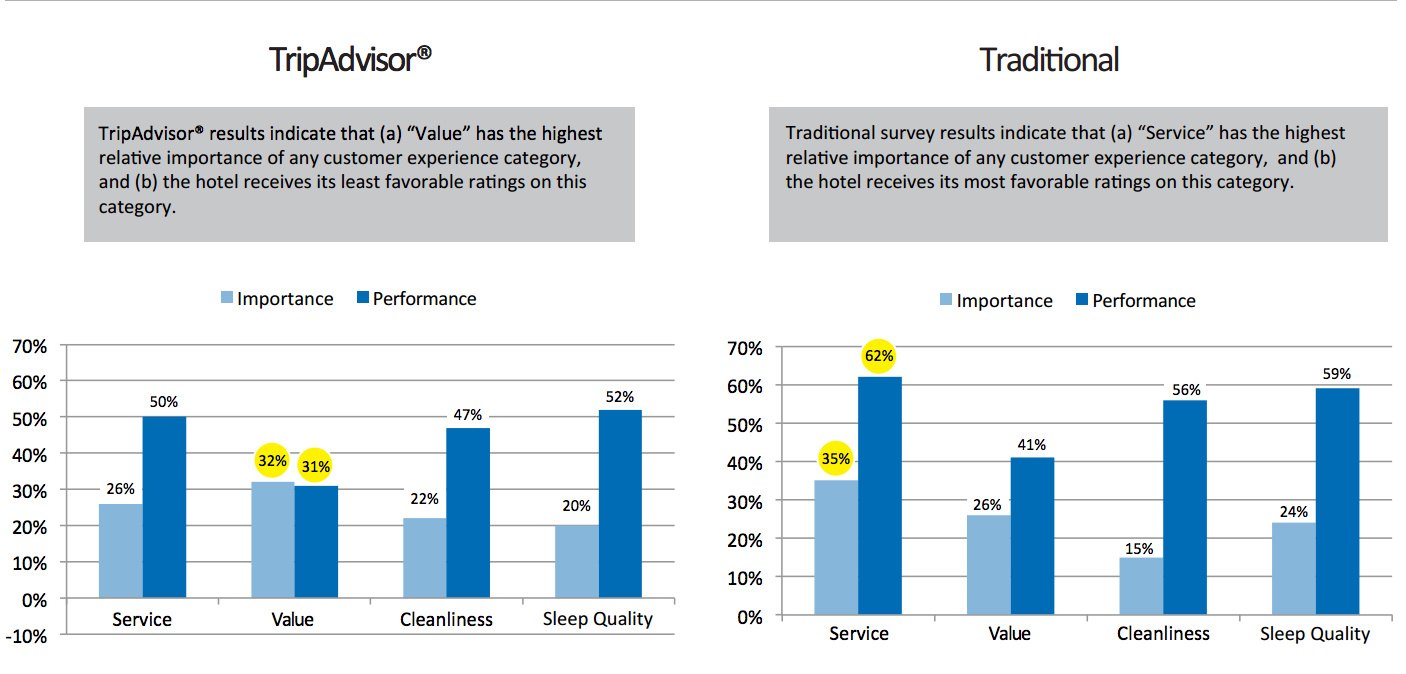
Randall Brandt, senior VP at Maritz Research took an interesting angle on this question Website vs. Traditional Survey Ratings: Do they tell the same story? His team took a sample of hotels which had many Trip Advisor ratings, and fielded a representative survey of recent guests asking the same questions.
The answers yielded qualitatively different conclusions about what aspects of the hotel experience drove customer satisfaction and perceived value. For instance, from Trip Advisor, one hotel would conclude "Value" is the most important driver of customer satisfaction, and that's their poorest performing attribute. Whereas from a broader representative survey of guests, one would conclude "Service" is the most important attribute, they are doing great at it (and they are also performing well on "Value" too).

Net net, this StackOverflow member survey provides a great example of when even the most social-media-savvy researchers might field a representative survey.
Source data
The source data for this survey is located at StackOverflow.


