Liars, damn liars, ... or just outliers?
July 31, 2015
Pieter Sheth-Voss

A key task in any survey is identifying outliers that can mar an otherwise great analysis. Outliers can arise for many reasons -- honest mistakes, careless entries, or outright bogus answers. Protobi makes outliers stand out so identifying them is as easy as shooting fish in a barrel.
Extreme and missing values
Protobi shows a histogram for each element, which makes extreme and missing/blank values stand out.For instance, immediately we can see in the example below that most respondents answered between 1 and 100 patients per week, but 3.1% of respondents answered between 980 and 1000. Click to drill into this value and you can see that these are all values of "999". So we might mark these respondents with a "Yellow flag" (see below).
Further, there are many [NA] responses, which may indicate faulty skip logic or that the survey didn't require an answer to this question. So we might mark these respondents with a "Yellow flag" too.
Overly frequent values
In this example here there are an unusual number of respondents with one IP address. In practice this can happen if respondents work at the same organization or have a common broadband provider. Or it can indicate multiple responses from the same respondent. So we might mark these respondents with a "Yellow flag" as well.
In this case, the IP address is from a known survey spam bot based in China, even though this is a survey of US doctors. If you click in to this value, we can see that all of the respondents also didn't answer the patient volume question above. So for these respondents we should definitely set a "Red flag".
Suspicious response patterns
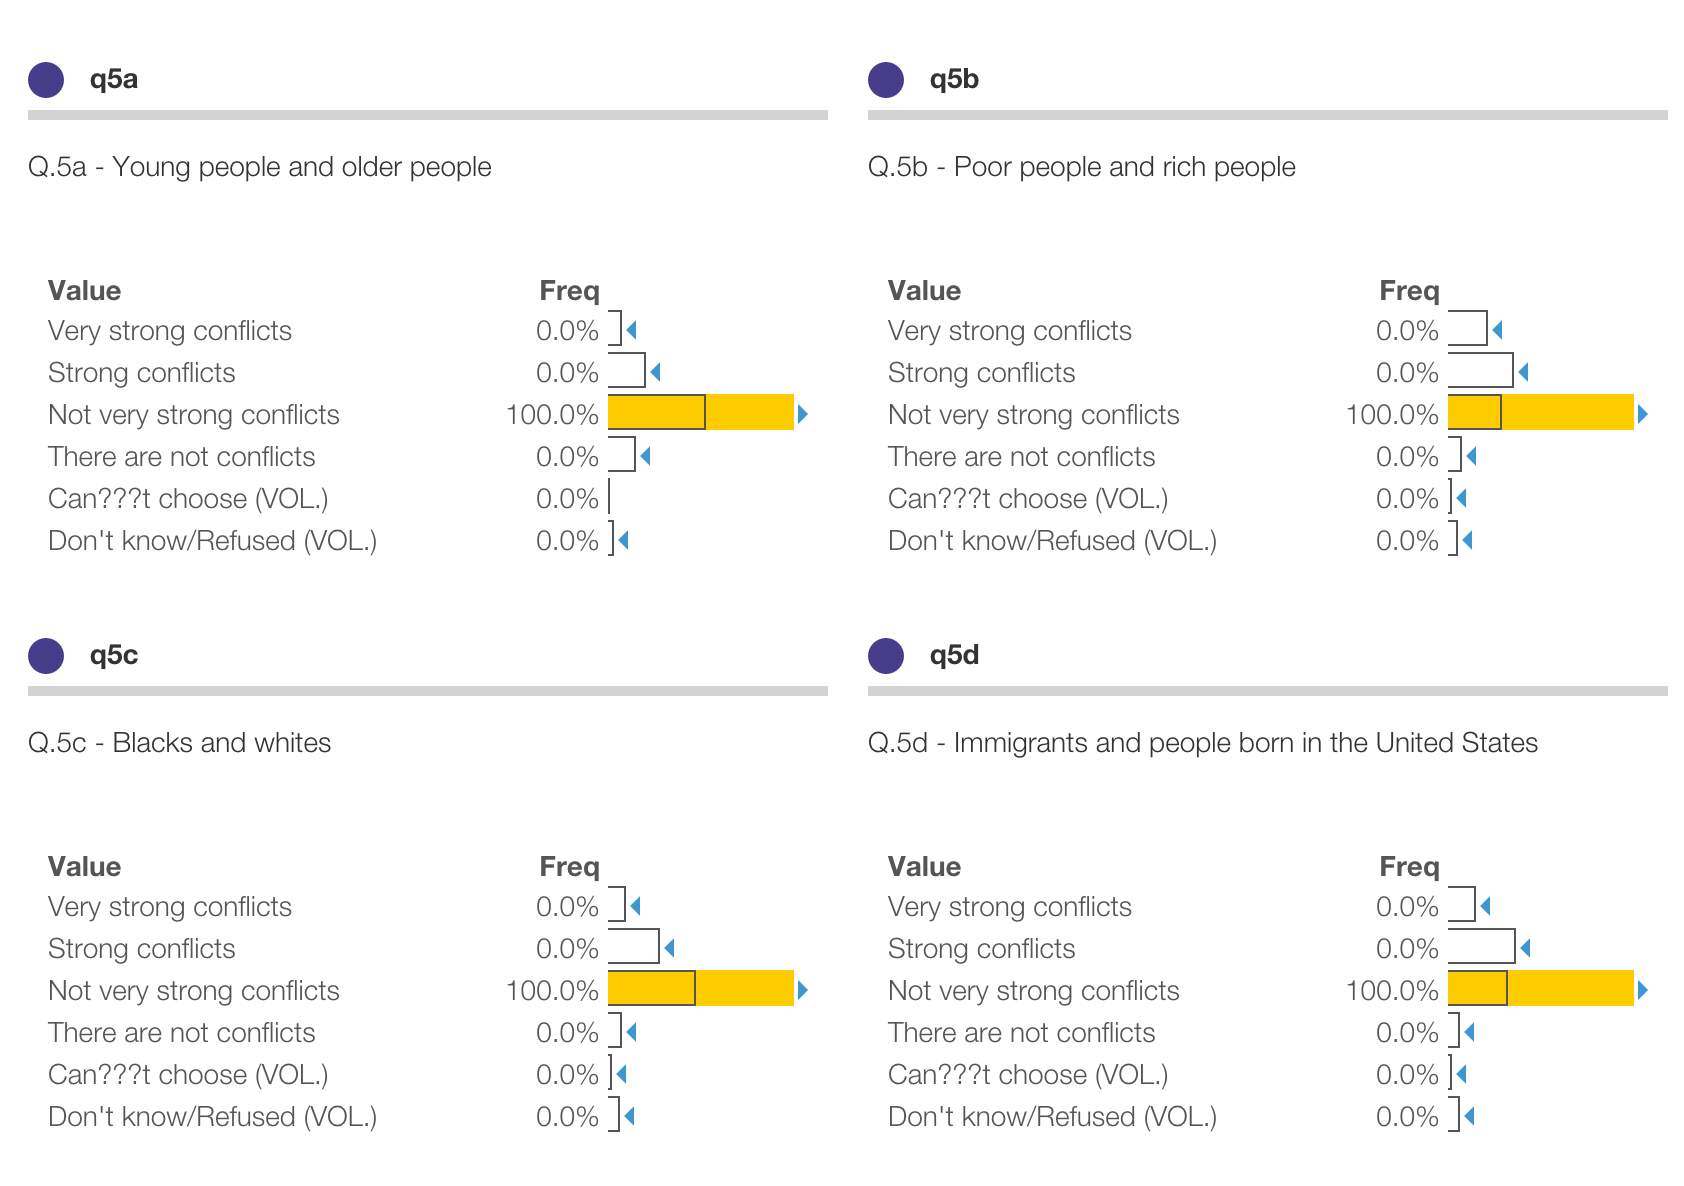
Another common pattern is respondents "flatlining" or giving the same response to a battery of questions, as in the example below. These are easy to spot in Protobi simply by clicking to drill in, as we've done here. And more sophisticated metrics are possible in Protobi. See Find and identify straightline respondents tutorial.
Flag outliers in Protobi
You can set Yellow and Red flags on respondents in Protobi. Drill into one or more respondents whose answers appear suspect, and click the "Flag" button in the toolbar:
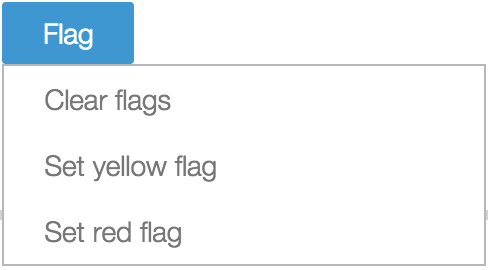
You can layer multiple flags:
- Setting a Red flag replaces a Yellow flag.
- Setting a Yellow flag will not override a Yellow flag.
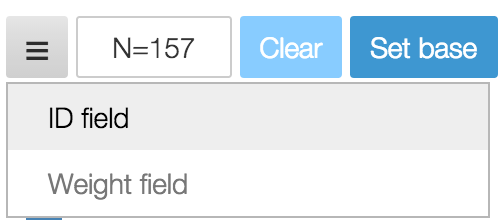
To turn on the Flag feature, set an ID for the project under the Project Settings button in the toolbar. This field should contain values that uniquely identify each respondent.