Protobi can show “net net” scores, subtracting one top-box score from another.
Top-box scores are useful to summarize answers on ratings scales. For scales that are bi-directional, it can be interesting to subtract one top-box score from another to get a single measure of balance.
In the example, below, respondents were asked their perceptions of different brands. The table shows thet net favorable, the net unfavorable, and the “net net”, often called the “Net Promoter Score” or NPS:
| 7% | 25% | 8% | 33% | 27% | 32% | 60% | -28% | |
| 9% | 32% | 7% | 28% | 24% | 41% | 51% | -10% | |
| 6% | 41% | 14% | 25% | 14% | 47% | 39% | 8% | |
| 3% | 16% | 9% | 37% | 36% | 18% | 73% | -55% |
Political surveys often show similar net net scores contrasting the percent of voters who are strongly or somewhat in favor of one candidate vs those strongly or somewhat in favor of another.
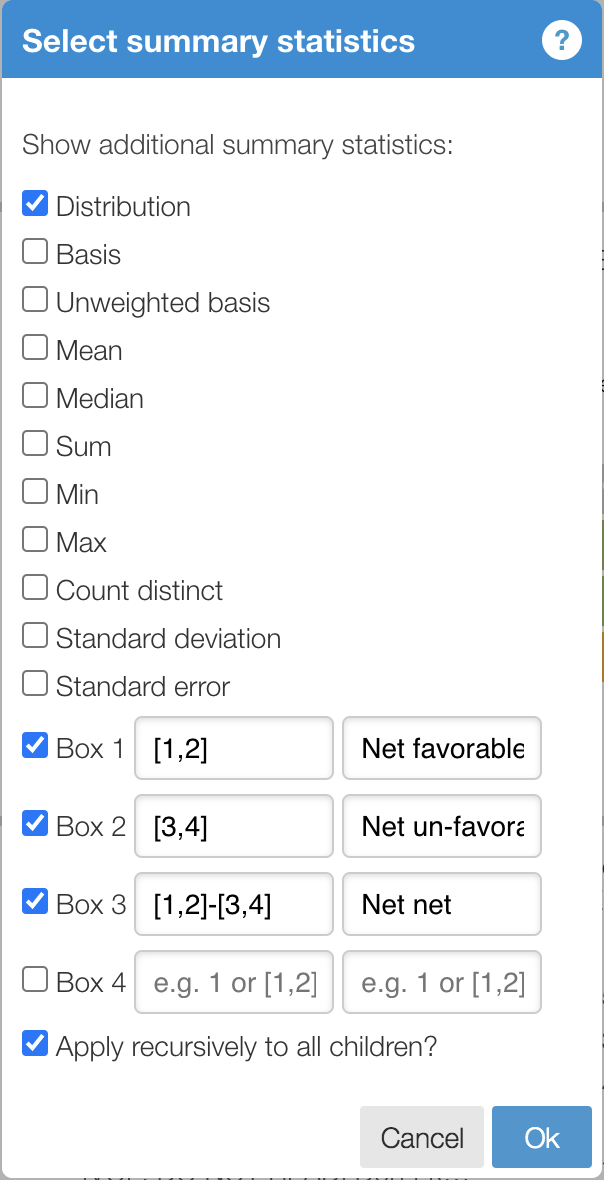
How to show top-box and net-net scores in Protobi
To add top-box and net-net scores, press the edit icon for an element or group and select “Statistics…” from the context menu. In the Statistics dialog: vi
- For a top-box score enter scale values separated by commas, e.g.
1,2or[1,2]. - For a net net score, separate groups by a minus sign,
e.g.1,2-3,4or[1,2]-[3,4]
You can give them optional labels below: