Protobi blog

Here’s how to to compute candidate market segmentations using R and profile them in Protobi, using the most recent StackOverflow Developer Survey as a case study.

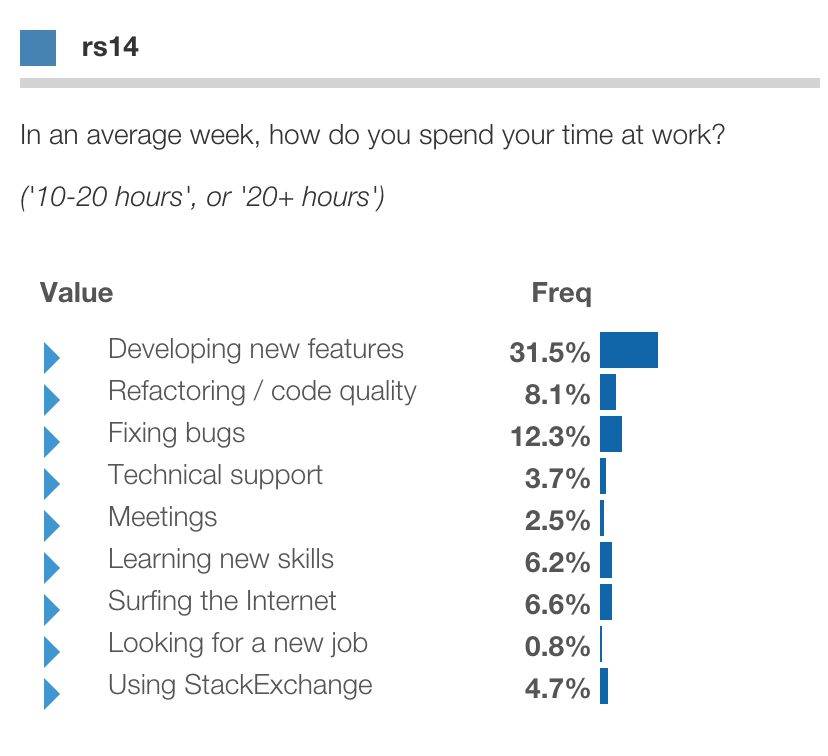
This yields a simple segmentation of developers based on what tasks they spend their time on ( note how little time in any country spent looking for a new job…)

read more

Real world data can come in a tremendous variety of shapes and sizes. Protobi can currently import data in two standard forms:

Depending on the form of your data, it might take a bit of prep to shape the data to streamline your work in Protobi. In the professional plans, our expert analysts can typically take care of this for you. If you’d like to do it on your own, here’s what you need to know.

read more

Use simple clicks to create nuanced queries. Click to select a specific value (“is”). Option + click to select multiple values within an element (“or”). Shift + click to exclude a value (“not”).

Filters on different elements apply simultaneously (“and”).

read more

Sign into Protobi, then drag your SPSS or CSV datafile into the “New Project” icon to instantly create an online visualization you can see, explore, organize and share.

read more

Create an instant crosstab by dragging one element to another. The element you drag defines the columns (or “banner”), and the drop target defines the rows (or “stub”). Drag the column name back out to clear the crosstab.Try it here…

read more