Interactive analysis is great for exploring the data, testing hypotheses.
Collaborating online is great for finding the story with colleagues and clients.
But in today’s business world, analysis still has to go into PowerPoint to tell that story to the broader organization.
Protobi lets you create visualizations that look more like your presentation than your survey. And export into your own PowerPoint template as editable chart objects.
Start out parallel to the survey
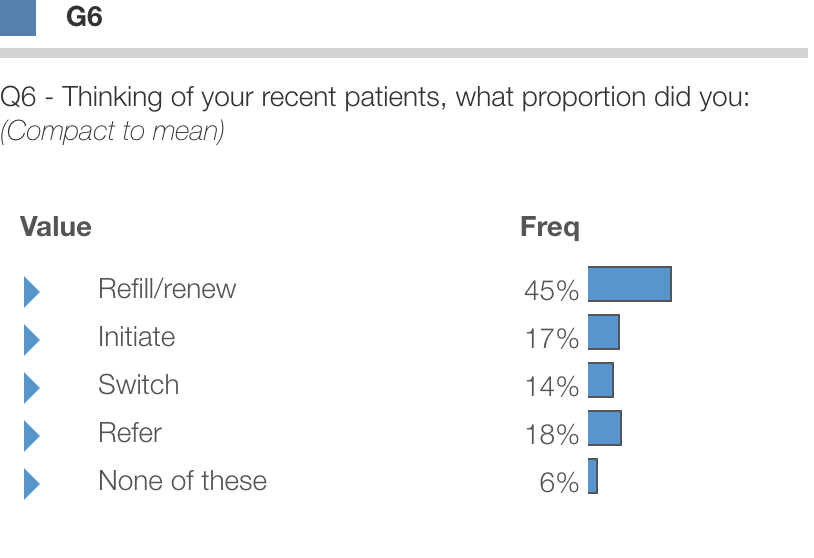
When you first open your survey, Protobi creates interactive bar charts for every question:
Interactively explore the data
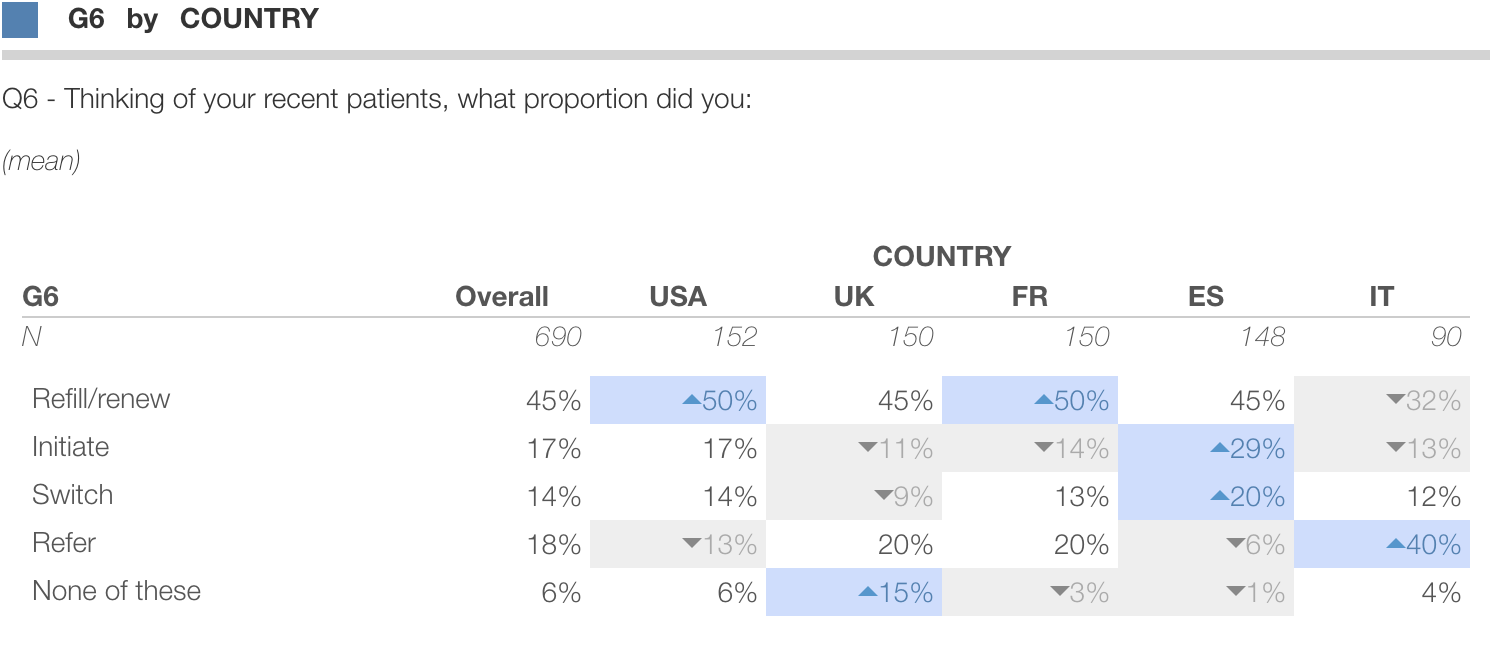
You can click to compare subsets, and drag to create interactive crosstabs, like below. Statistically significant differences are highlighted to identify interesting differences. You can export to Excel as tables to create your own charts or PowerPoint as a good default chart.
Custom charts
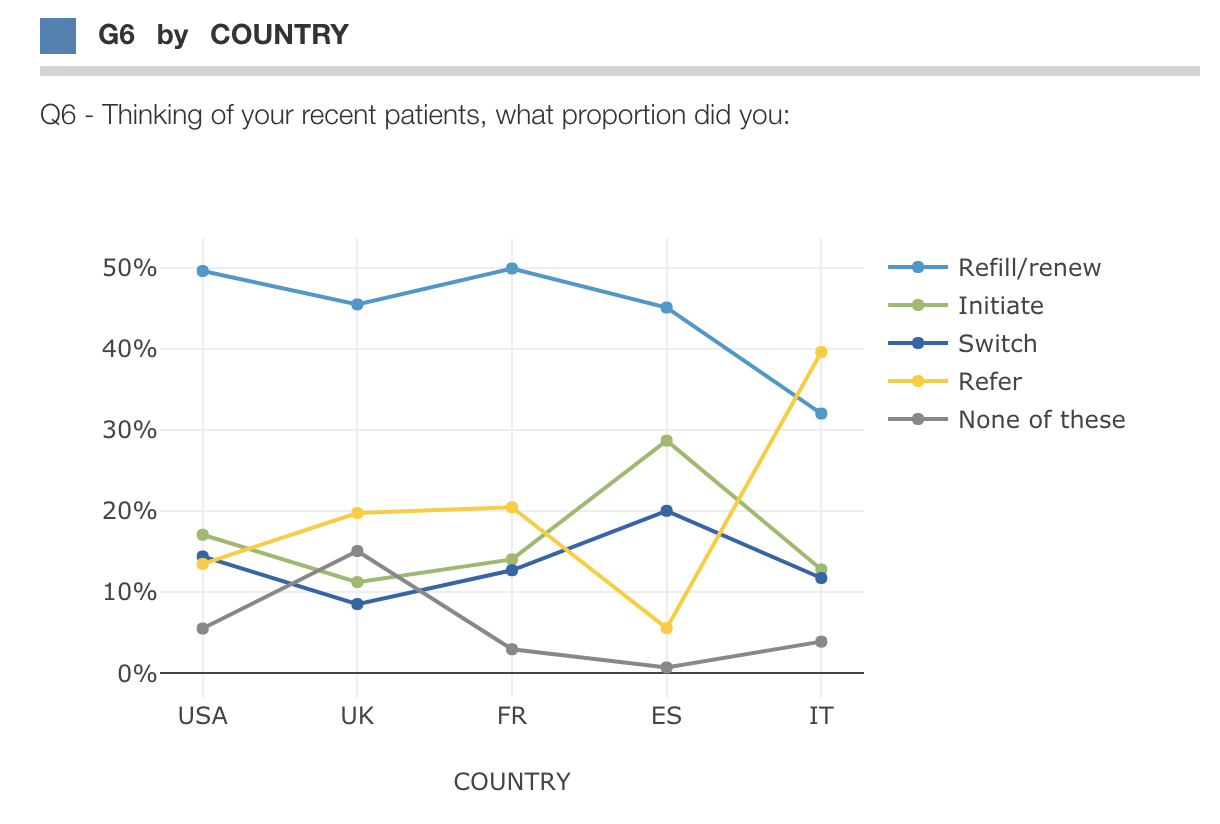
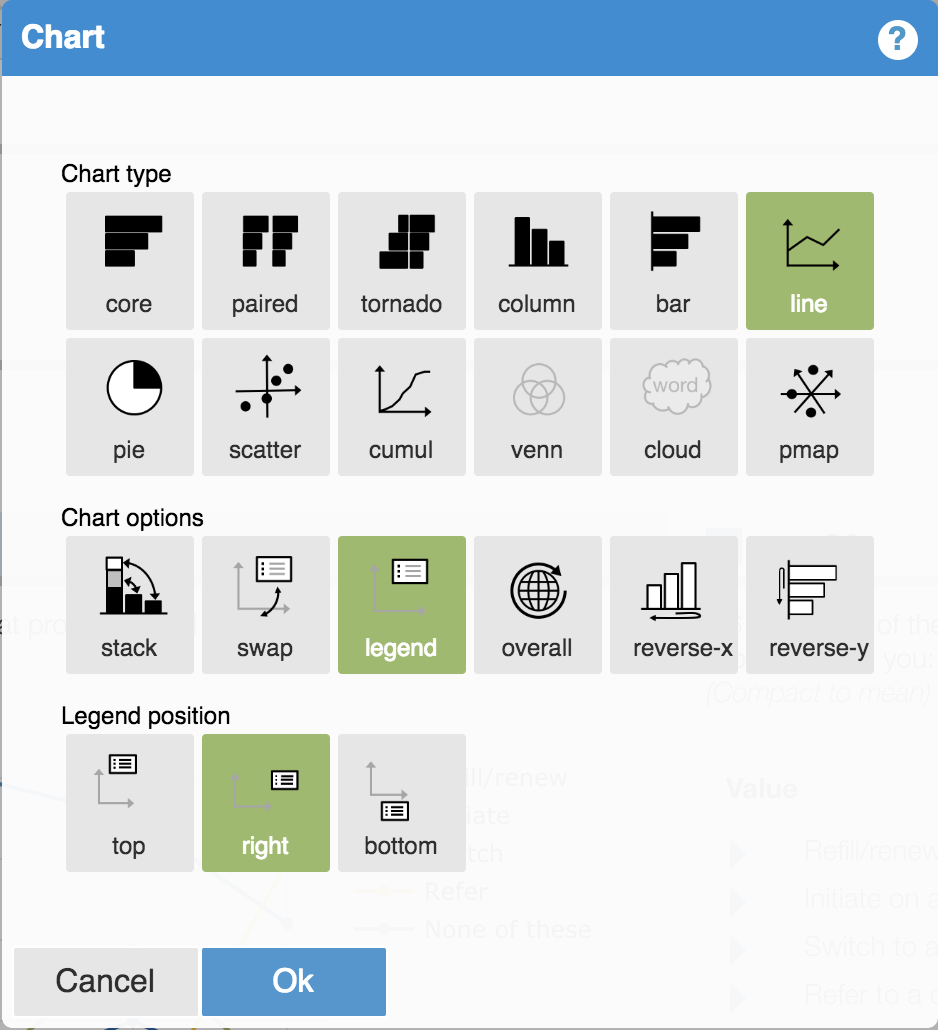
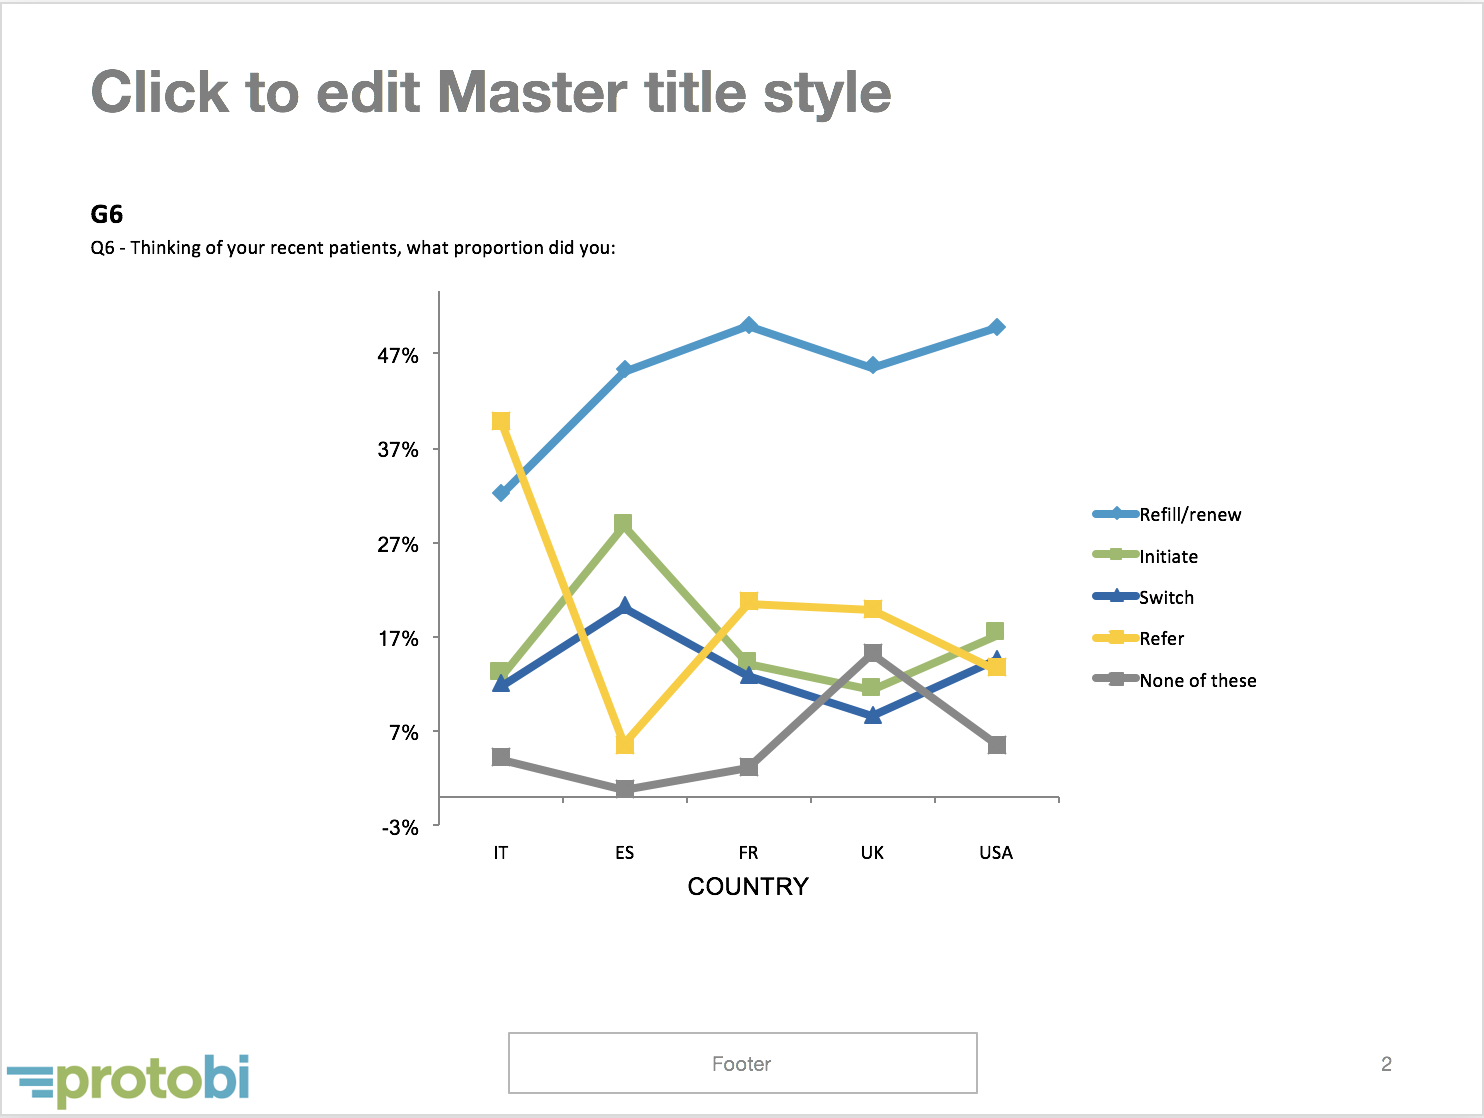
Now here’s where the charting fun begins. Press the square icon and choose “Chart…”. You can choose from a wide array of applicable chart types. Here we set Chart type to “line”, with the legend visible and to the right:
Protobi now shows a line chart. Here it’s using Protobi’s standard color, but you can set your own color scheme for your firm, for just this project, or even for just this one chart.
Optionally, you can clone the element before creating the chart, so you have two views … (a) the original crosstab with data and stats tests, and (b) a colorful line chart.
See the Protobi Chart Types tutorial for an overview of chart types and options….
Export charts to PowerPoint
When you export this chart to PowerPoint, you’ll get a native editable PowerPoint chart with the same chart type, colors, and options. PowerPoint has its own chart options, so it may not be exactly the same, but as close as we can reasonably get.
Did we mention this is an editable native PowerPoint chart? You can further customize it as your prefer.
You can upload your own (or your client’s) PowerPoint template, and the resulting file will preserve the colors, themes, slide layouts and content of your template file.