Protobi blog

Protobi is not just a pretty face for the data, it also provides a full-featured language for data cleaning and reshaping prior to analysis.

No matter how carefully you design a survey there are almost always changes you need to make to the data once it comes back:

  • combine multiple waves of an ATU
  • merge in translations for text open-ends in other languages
  • stack patient cases
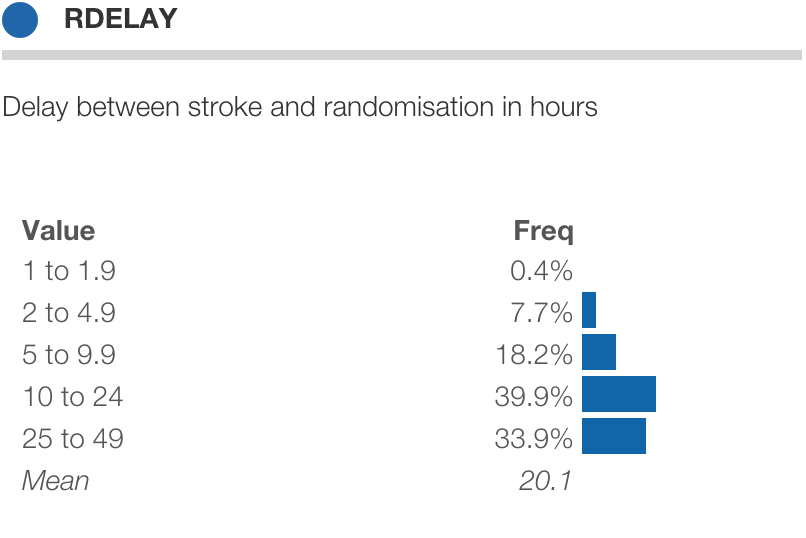
  • calculate time intervals
  • define segmentations
  • remove outliers
  • zero-fill skipped values

You can now do all of the above (and more) within Protobi.

Previously you might have used SPSS, R, or external vendors to do this externally. You can still do that, and upload the results to Protobi as you wish.

But now you can also keep all your processing code in one place, integrated with your analysis, and documented.

Strapped for time? We’re happy to set up your data cleaning and reshaping for you, and show your analysts how to edit or author it.

read more

Back-to-school season entails all the necessary checkups and health exams.
Seeing where the kids fell on the height weight standards chart, I noticed that the charts all seem to conveniently stop at age 20. What would they look like if extended for adults?

read more

Thanks to our users for awesome suggestions in a recent series of user labs! Key themes:

  1. using Protobi to create client deliverables on rapid timelines and
  2. presenting Protobi as a client deliverable.

This release introduces several new capabilities:

  • Copy elements rather than just move them
  • Find-and-center an element by double-clicking on it in the tree.
  • Save scenarios in a new toolbar button
  • Evaluate scenarios as a segmentation for crosstabs
  • Define new segmentations logically using Mongo-style constraints.
  • Define new segmentations functionally using Javascript expressions.

read more

A frequent question prospective clients ask is “How are you different from Tableau?”

On the surface, Protobi and leading BI tools are similar in that both create clickable graphs and tables from data. Beyond that they’re radically different tools for different purposes, and even coexist quite nicely.

read more

Was encouraged to participate in the MIT Big Data Hackathon at Hack/Reduce in Cambridge, MA this weekend by a friend Ashwini Kumar, principal engineer at Senscio Systems. The very idea of signing up to work into the wee hours amongst the super talented people one would imagine would be there seemed both intense and pretty intimidating. But he’d been to these before and assured they are really positive sessions from which you learn a lot you’d never expect. Plus my kids thought the idea was cool. So I was in. And wow, they were right.

read more

“Hey, is there any way we can see this data as a perceptual map? I’d love to show this to the marketing team tomorrow.” Thus was the question posed by a smart client who likes to present synthesized findings rather than just raw data.

The next question was “How can we make this easier to see?” Together we worked out a new take on Perceptual Maps to make more fun…

read more

You can now export Protobi visualizations as Excel workbooks with statistical tests. Set a crosstab banner and generate an entire deck of crosstabs. Use it for your own advanced analyses or send it directly to a client. Export Protobi to Excel

read more

“This is great! How can I export visualizations to PowerPoint for my clients?” We hear you!

Click the 'Export' toolbar button to export selected elements

You can now export Protobi visualizations as PowerPoint presentations:

  • Charts are native PowerPoint chart objects
  • Data is embedded as Excel worksheets

read more

Style update showing baseline distributions as black outline

We’ve updated the look of Protobi!

  • Current distribution as a single solid color
  • Baseline distributions as a thin black outline

This is based on end user feedback from user labs with our clients and theirs. As before:

  • Blue triangles show statistically significant differences
  • Gold bars show active filters

A key strength of Protobi is its ability to show statistical contrasts, comparing one subset to another. The design challenge is how to make this is clear, intuitive, and aesthetic. We think this strikes the balance.

read more

Heading 1

Nested crosstab of StackOverflow reputation versus gender within years of experience

You can now run nested crosstabs within Protobi! Hold the Shift key when dragging to nest an additional elements in the banner.

  • For an individual tabs, drag an element onto another
  • For global tabs tabs, drag an element to the Crosstab button.

Nested crosstabs are useful to untangle confounding across multiple factors.

read more

International Stroke Trial: distribution of delay from stroke to randomization.

The International Stroke Trial (IST) was one the biggest randomised trials ever conducted in acute stroke. Patients were assessed at randomisation, at the early outcome point (14-days after randomisation or prior discharge) and at 6-months.

There is an incredible lack of transparency in clinical trial results today. A team at the University of Edinburgh has been working to change that, and has made the individual patient-level data available for public use, to facilitate the planning of future trials and to permit additional secondary analyses. Explore the data in Protobi.

read more

Every year the US Center for Disease Control (CDC) conducts the National Ambulatory Medical Care Survey (NAMCS), a national patient chart review with outpatient physicians. This annual survey collects details for over 32,000 patient visits from 3,000 doctors in 15 major specialties.

read more

Global Impact Study: Q5-1 Value of Public Access Venue for Internet Connectivity

Libraries, telecenters, and cybercafés play a critical role providing information and communication technologies (ICTs) to a diverse range of people worldwide. However, their ability to contribute to development agendas has come into question in recent times.

The goal of The Global Impact Study was to measure the impact that funding of Public Access Venues (PAV) for internet connectivity has had, in eight countries: Bangladesh, Botswana, Brazil, Chile, Ghana, Lithuania, the Philippines, and South Africa.

read more

Stack Overflow released the results and data for its 2013 annual survey of members. With 7,643 respondents it provides a fascinating glimpse what developers are working on, what they’re excited about, their Stack Overflow activity, salary and careers. Explore the data in Protobi.

read more

Eurobarometer Attitudes, Robot image 1 Eurobarometer Attitudes, Robot image 2

The European Commission recently released original data for its 27-country Eurobarometer survey on public attitudes towards robots. Click here to explore this dataset in Protobi.

read more

Pew Research Gender and Generations Survey in Protobi

Pew Research recently released its Gender and Generations Survey survey. This survey of US adults covers a range of demographics and attitudes, including health, wealth, household makeup, and family/work/life activities. Click here to explore the data visually in Protobi.

  • Click on responses to drill in, e.g. to compare how people who consider themselves “Very happy” or “Extremely happy” versus those who do not.
  • Drag-and-drop variables to create crosstabs, e.g. vs “Q2. How would you rate your own health?” .

Contact us at inf@protobi.com to create an in-depth view of your research data.

You can download the data directly from Pew Research. Note: The Pew Research Center bears no responsibility for the analyses or interpretations of the data presented here.

read more

Pew Research Gender and Generations Survey in Protobi

Pew Research Gender and Generations Survey is now available in Protobi. This survey of US adults covers a range of demographics and attitudes, including health, wealth, household makeup, and family/work/life activities.

It’s actually fascinating to explore, to see what does and does not correspond with self-rated happiness.

read more

Heard Bob Caspe, an experienced entrepreneur and adjunct professor of business at Babson, speak at the Venture Cafe at the Cambridge Innovation Center. A brilliantly engaging speaker, with a smart crowd in the room. Key takeways:

read more

Out of curiosity, I wanted to see how a particular firm would compare to other publicly traded firms should it go public as expected, on a number of ratios, including revenue per employee.

read more